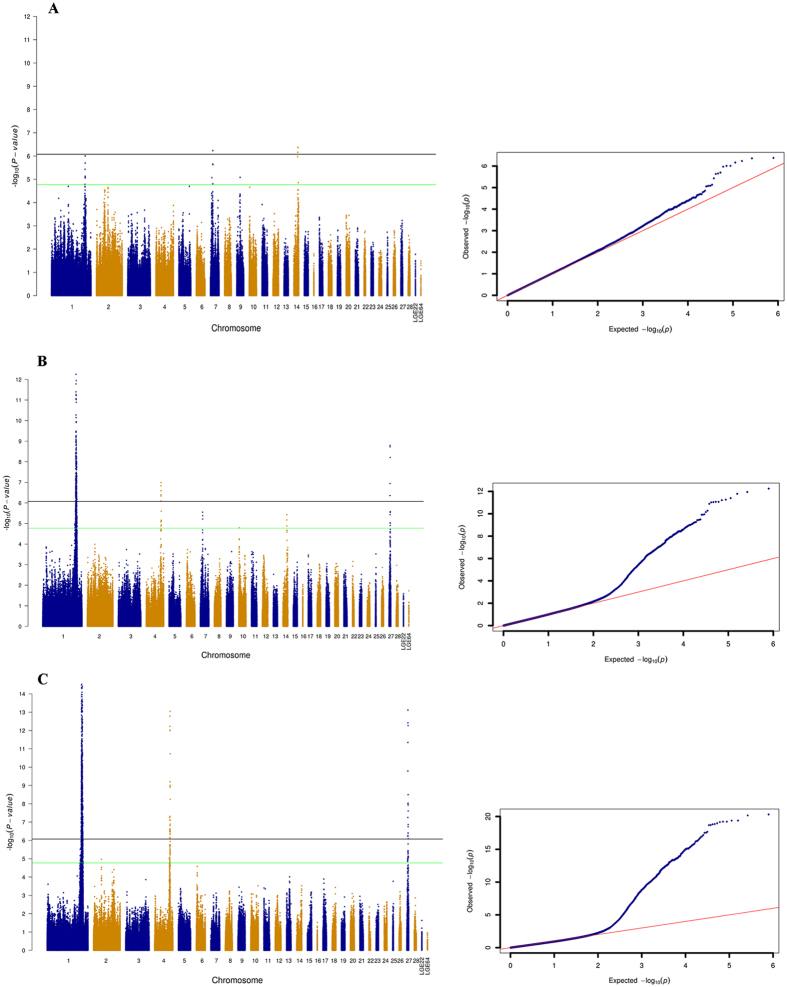
Figure 1. Manhattan and quantile-quantile (QQ) plot displaying the significance signal associated with femur traits.
The single-trait analyses on femur BMD (A), BMC (B) and femur weight (C); the horizontal black and green lines indicate the whole-genome significance (P = 8.43 × 10⁻⁷) and suggestive thresholds (P = 1.69 × 10⁻⁵), respectively.

