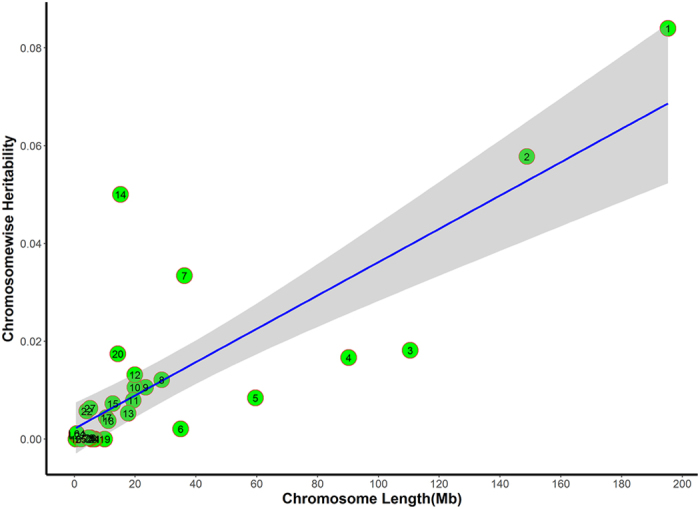
Figure 4. Heritability of femoral BMD by chromosome.

Estimates of chromosome-wise heritability on BMD are drawn against the chromosome length (x-axis). The blue line represents heritability regressed on chromosome length. Grey area around the blue line is the 95% confidence level interval for prediction from the linear model. Chromosomes 7, 14, and 20 fell outside of the 95% confidence interval, indicating that these chromosomes could explain more heritability than expected according to chromosome length.
