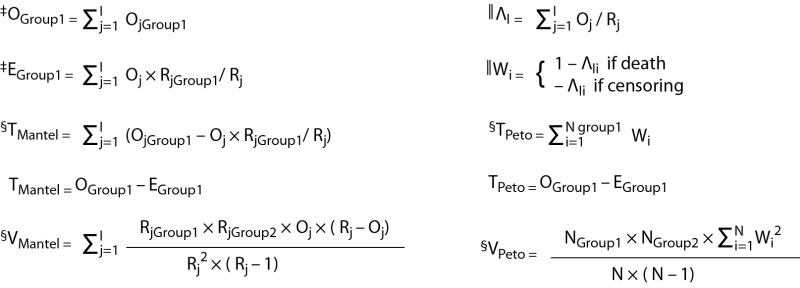
Table 1. Mathematical overview of three different log-rank test variants.
| Key steps in data analysis | The Cox-Mantel test | The simple χ2 log-rank test | The Peto log-rank test |
|---|---|---|---|
|
Step 1 (Data sorting)* |
Data are sorted in a time ascending order. At the time of each death, a new interval is created. | ||
|
Step 2 (Preliminary calculations)† |
 |
||
|
Step 3 (Calculation of χ2 value) |
 |
||
|
Step 4 (P value) |
P values that correspond to calculated χ2 values are found using one degree of freedom χ2 distribution table. | ||
| *Step 1 (Sorting data) is same for all three methods. Intervals are necessary if we want to obtain correct calculations when more than one death occurs at the same time (tied observations). All concurrent deaths are considered to happen in the same interval. Central calculations for all three methods are interval specific (i.e. occur at death times). †Step 2 (Preliminary calculations) is necessary for later calculations of χ2 value. The Cox-Mantel test and the simple χ2 test share calculation of observed and expected number of deaths. ‡O, E, R and I represent observed number of deaths, expected number of deaths, number of patients at risk and number of intervals, respectively. Oj, Ej and Rj (j=1,..,I) represent aforementioned parameters at the time of the j-ordered interval. §T and V represent test statistic and variance for particular test variant, respectively. The Cox-Mantel test and the Peto log-rank test produce the same test statistic. Calculations are done in one of the groups only. Variance for both methods is calculated on a whole data-set. N, ΛI and W represent number of observations, the Nelson-Aalen estimator for a particular interval and a specific Peto log-rank test score, respectively. Ni, ΛIi and Wi (i=1,..,N) represent aforementioned parameters at the time of the i-ordered observation. | |||
