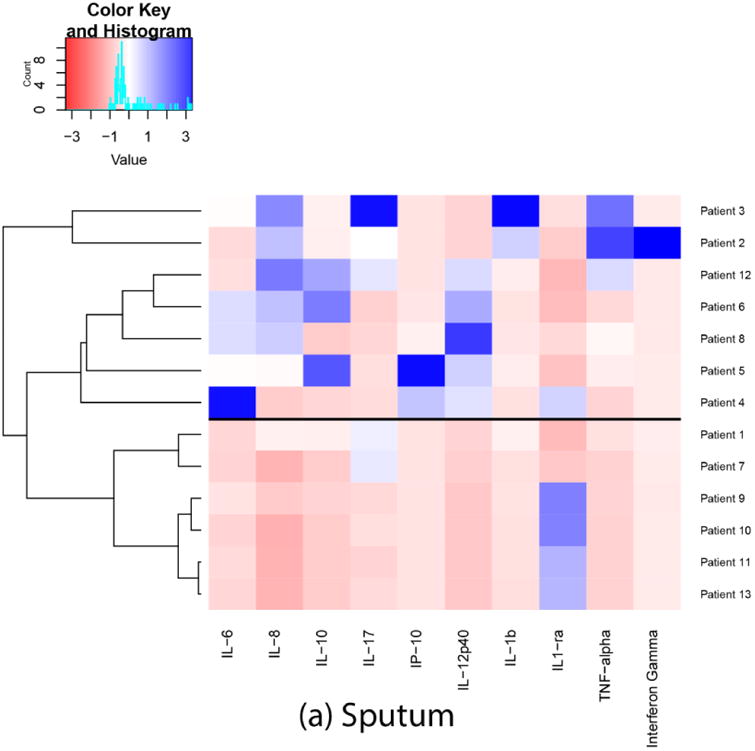
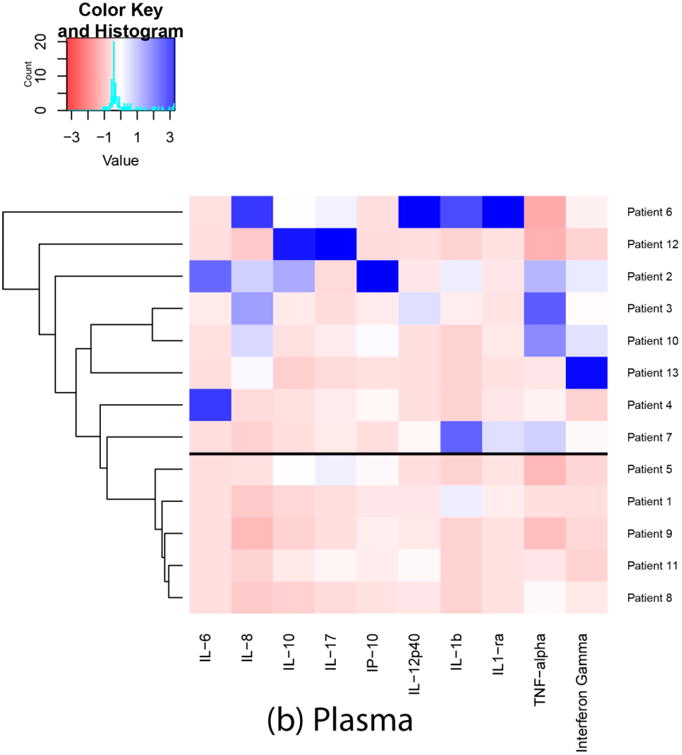
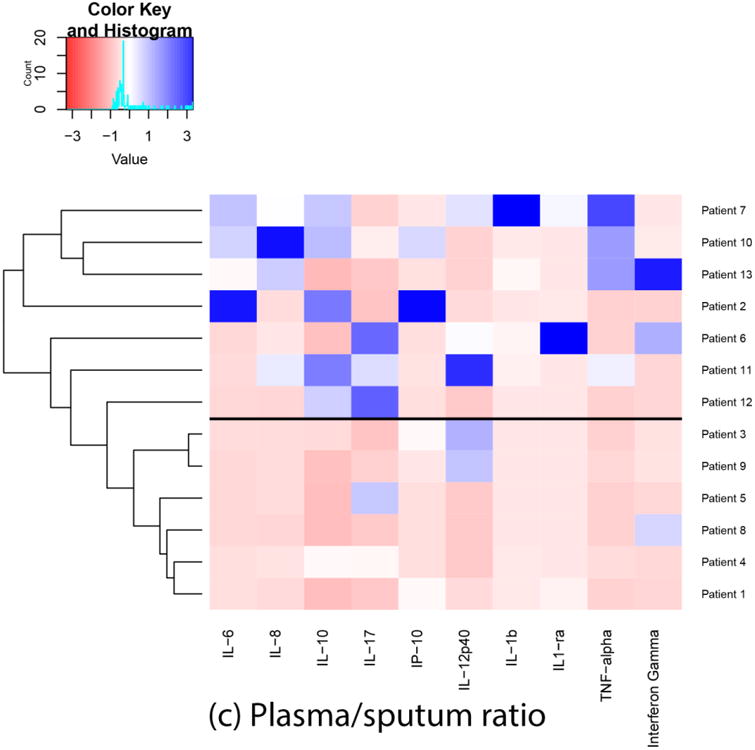
Fig. 1.


Heatmaps and dendrograms for cytokines in sputum and plasma. Each heatmap and dendrogram depict some separation of patients' inflammatory response. The cophenetic correlation coefficient comparing the clustering of patients in plasma and sputum determinations was 0.14, suggesting low correlation between plasma and sputum clusterings. a horizontal line was drawn to indicate a suggested separation of inflammatory response patterns based on the cluster dendrograms and visual inspection of the heatmaps.
