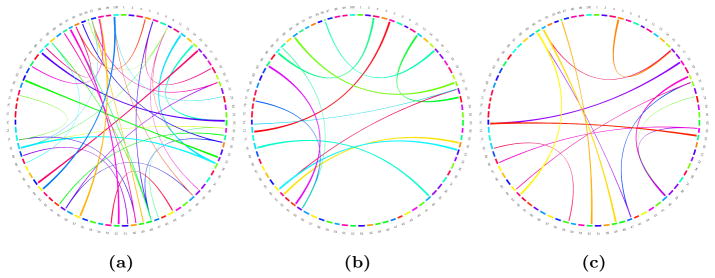
Figure 15.
Visualisation of the absolute difference between connectivity networks: (a, b) difference between the networks obtained for two subjects using single subject parcellation (a), and group-wise parcellation (b); (c) difference between the average networks for the two different groups tested. The circle represents the parcels on the cortical surface, connections are the edges connecting the parcels. The edges and their thickness correspond to the difference in connectivity strength (probtrackX fibre count) between the compared networks. The different colours are used here for visualisation purposes to differentiate the edges.

