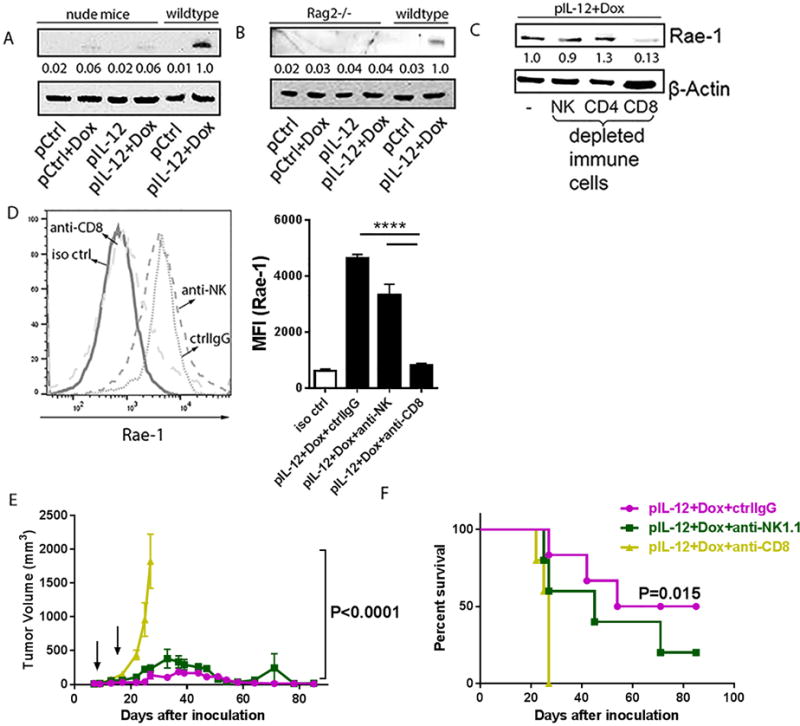
Fig. 4. Tumor-specific Rae-1 elevation requires CD8+ T cells.

(A, B) Immunoblots of Rae-1 in 4T-1 tumor samples from nude mice (n=3) or LLC tumor samples from Rag2−/− (n = 3) that were subject to one of the four standard treatments. (C) Immunoblots of Rae-1 in LLC tumor samples from mice (n = 3) that received IL12 plus doxorubicin plus control IgG or one of the immune cell–depleting antibodies as shown. (D) Flow cytometry analyses of Rae-1 in LLC tumors subject to the same treatments as (C). (E, F) Tumor volume (E) and survival time (F) of LLC tumor bearing mice (n = 5) subject to the same treatments as (C). Intensity quantification (intensity of Rae-1/intensity of β-Actin) shown under each blot represents the mean intensity of three repeated experiments. Bar graphs (D) show the mean fluorescence intensity (MFI) of Rae-1 as means ± SEM (n = 3). Results are representative of three repeated experiments.
