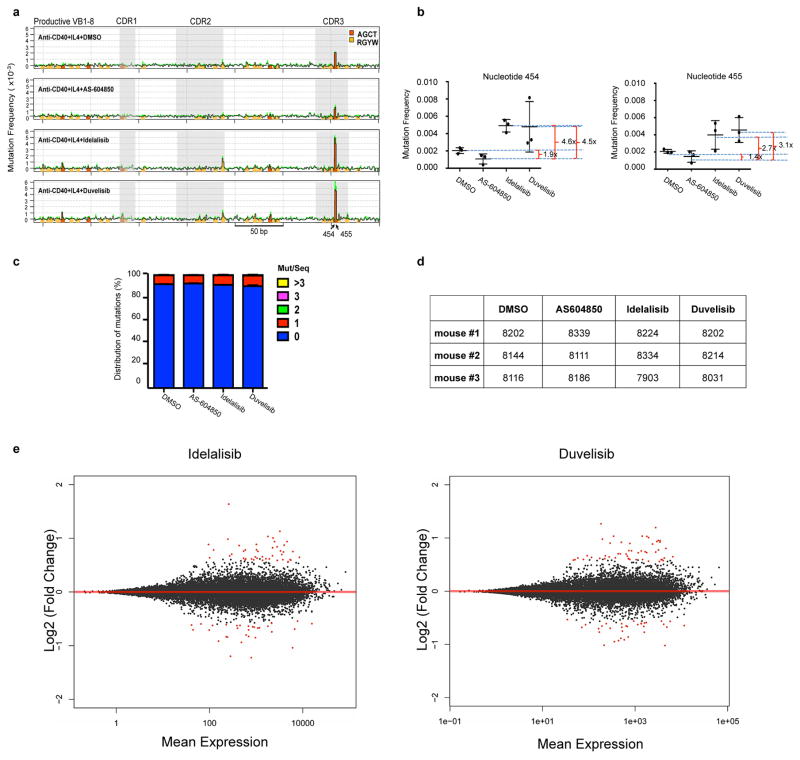
Extended Data Figure 4. PI3Kδ blockade increases somatic hypermutation (SHM) frequency in Igh V region in activated mouse B cells and transcription of genes.
a, Map of mutations on the VB1-8 productive allele sequence in activated B cells treated with the indicated inhibitors. The y-axis indicates the mutation frequency at each nucleotide in sequences that have 0 to 2 mutations per sequence at day 4 of stimulation after subtraction of mutation frequency at day 0 of stimulation. Green shading indicates top s.e.m. from three independent mice. Orange and yellow bars mark the positions of AGCT and other RGYW motif that is not AGCT, respectively. One experiment is represented out of three biological replicates with similar results. b, Mutation frequency of nucleotide 454 (top) and 455 (bottom) of the VB1-8 productive allele at day 4 after subtraction of mutation frequency at day 0. Data represent mean of three independent stimulations of B cells from three independent mice. Error bars indicate s.d. Fold changes between each mean are indicated. c, Stacking bar chart shows percentage of sequences that have the indicated number of mutations per sequence. Data are displayed as the mean from three independent stimulations of B cells derived from three mice. Error bars indicate s.e.m. d, The number of reads from individual mice for the data are shown in (a). e, MA plots of log fold-changes generated by DESeq2 in R package against mean expression (normalized counts) from GRO-Seq data for idelalisib or duvelisib over DMSO. Red dots indicate significantly up-regulated genes (n=39 in idelalisib, n=47 in duvelisib) or down-regulated genes (n=32 in idelalisib, n=33 in duvelisib) with multiple test adjusted P value < 0.1 (Supplementary Table 3).

