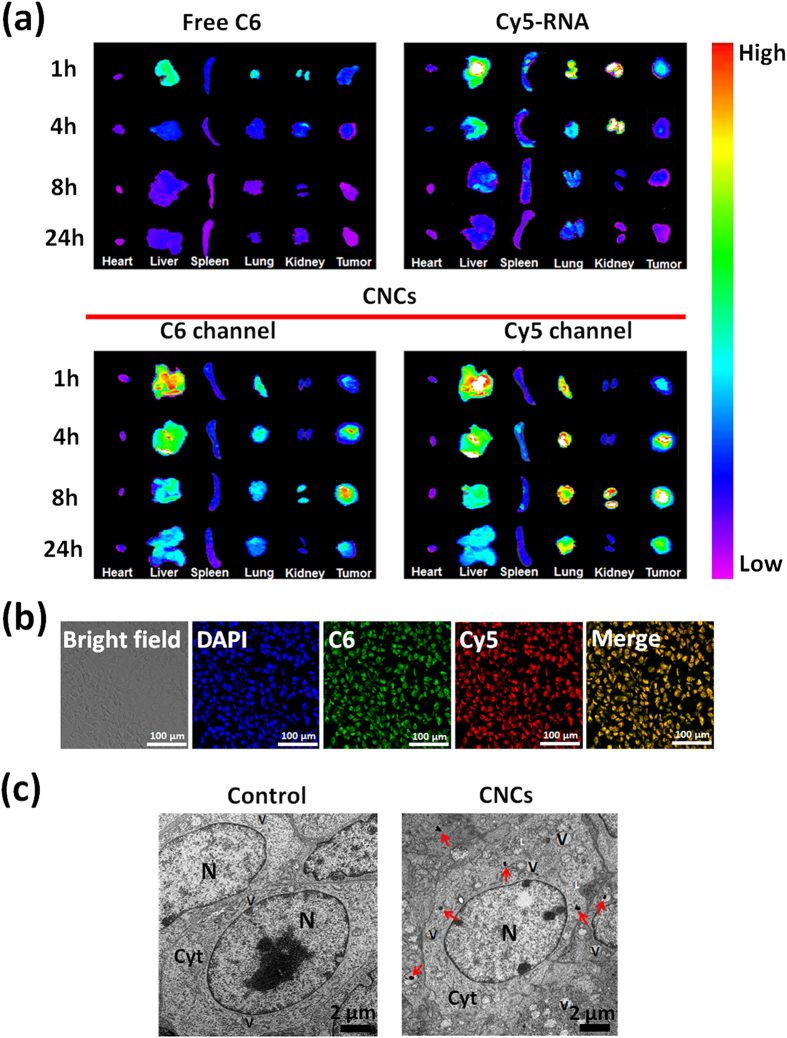
Figure 8. In vivo imaging and biodistribution of CNCs in 4T1 tumor-bearing mice.
(a) Ex vivo fluorescence images of heart, lung, kidney, spleen, tumor and liver harvested from the mice at 1 h, 4 h, 8 h and 24 h after injection. (b) Biodistribution of dual fluorescence-labeled CNCs in tumors harvested from tumor-bearing mice at 4 h post-injection. Cell nuclei were stained with DAPI. C6: green; Cy5-RNA: red; Scale bar: 100 μm. (c) TEM images of sections from isolated tumor collected at 4 h post-injection. The control group was the tumor harvested from tumor-bearing mice without treatment. Red arrow heads indicate the distribution of the CNCs. Cyt, cytoplasm; N, nucleus; V, vesicle; L: lysosome. Scale bar: 2 μm.

