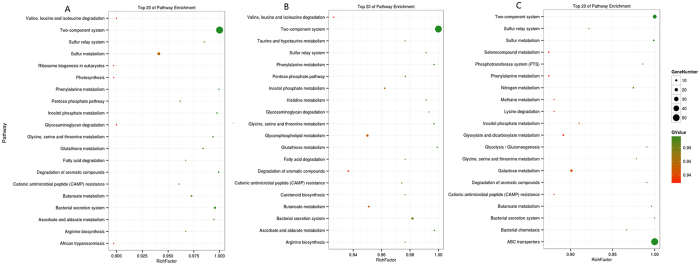
Figure 6. KEGG enrichment analysis of the difference groups.
(A): CK-VS-CF5; (B): CK-VS-CF10; (C): CF5-VS-CF10. Rich Factor: The ratio of the number of differentially expressed genes and the total number genes which located in the pathway genes. The greater the Factor Rich, the higher the degree of enrichment. P-value closer to 0, the more significant enrichment.

