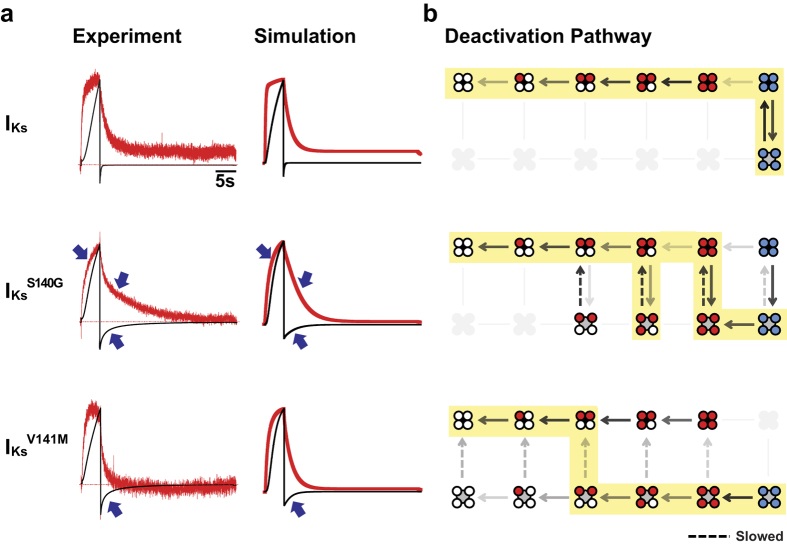
Figure 7. Simulating the gating effects of S140G and V141M in the presence of KCNE1.
(a) Comparing experimental with simulated current (black) and fluorescence (red) traces for IKs (top), IKsS140G (middle), and IKsV141M (bottom). (b) Description of deactivation pathways at −100 mV based on model rates. Arrows with greater opacity represent higher probability of channels entering the transitions specified. States that channels rarely or never enter are grayed out. Highlighting illustrates the most probable pathway of channel deactivation based on rates at −100 mV, starting from the fully activated open state. IKs channels opens and closes only when voltage sensors are fully activated (top). IKsS140G alters VSD-pore coupling and slows pore closing, altering the deactivation pathway such that during early steps of voltage sensor deactivation, channels may repeatedly open and close several times (middle). Like IKsS140G, IKsV141M also alters VSD-pore coupling to allow channel opening in intermediate VSD states (bottom). In addition, IKsV141M slows pore closing. However, the deactivation pathway is different from IKsS140G in that voltage sensors deactivate to a greater extent prior to pore closing.

