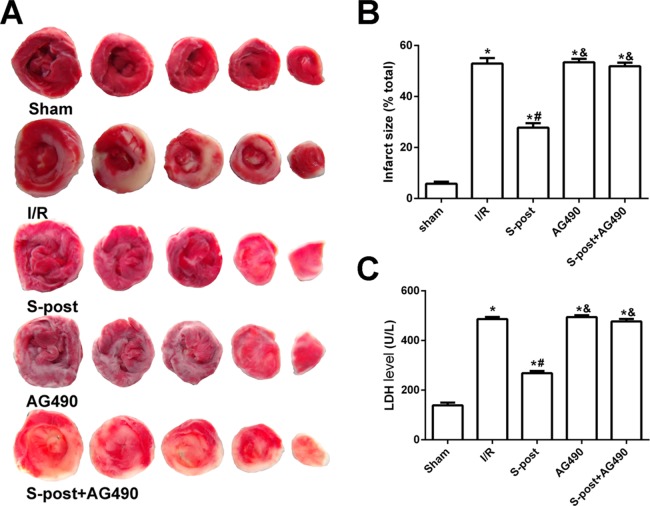
Figure 3. S-post reduce myocardial infarct size and LDH release (n = 12/group).
(A) Myocardial infarct size, the infarction zone (white) and risky zone (red). (B) Myocardial infarct size (IS) expressed as the percentage of the infarct area relative to the total at-risk area after 2 h of reperfusion; (C) The LDH release level. *p < 0.05 compared with sham group, #p < 0.05 compared with I/R group and &p < 0.05 compared with S-post group.

