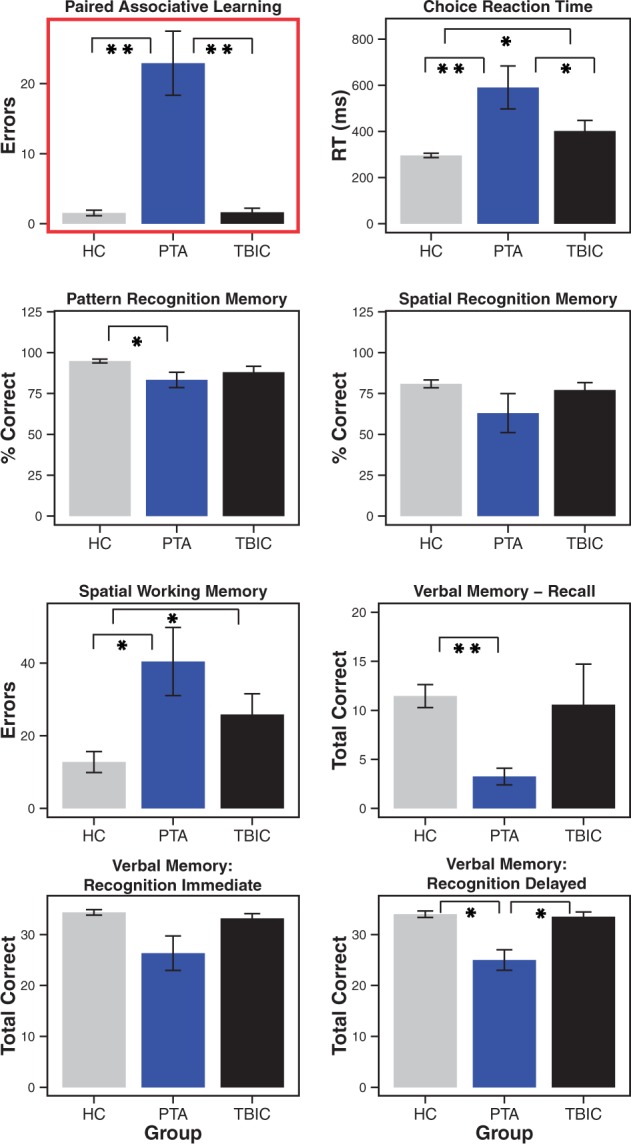
Figure 2.

Neuropsychological results for PTA patients compared to TBI and healthy control groups at baseline. All tests are derived from the Cambridge Neuropsychological Test Automated Battery (CANTAB) computerized tool. **Significance at P < 0.01; *significance at P < 0.05. Error bars represent the standard error of the mean (SEM). HC = healthy controls; TBIC = TBI controls; RT = reaction time.
