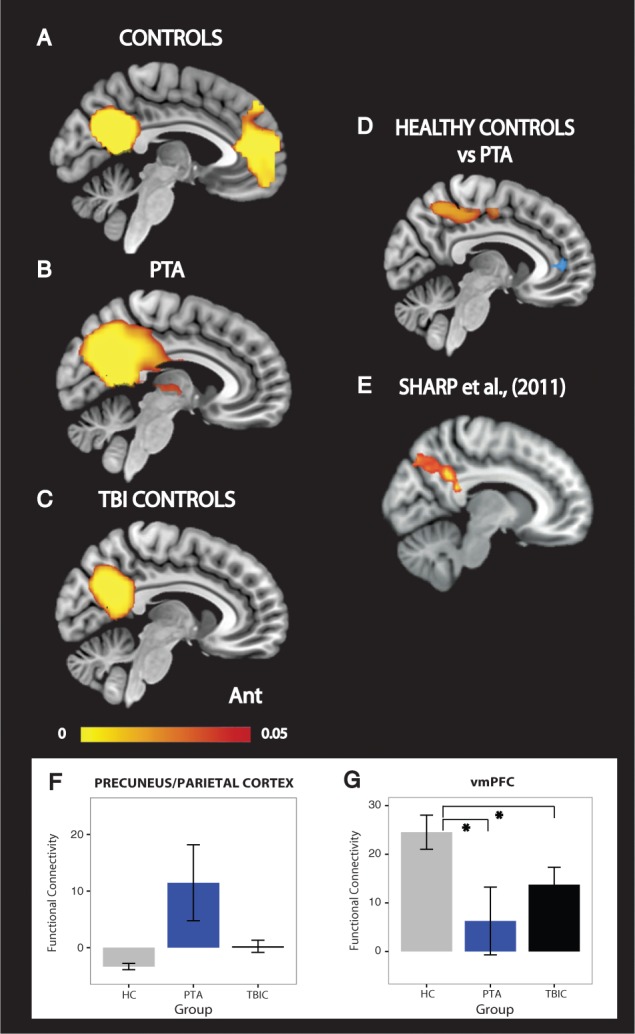
Figure 4.

Functional connectivity within the DMN. Functional connectivity of the PCC to the rest of the DMN in (A) healthy controls (HC), (B) PTA patients and (C) TBI controls. (D) The direct contrast between PTA patients and healthy controls. Yellow-red colours indicate areas of increased functional connectivity in PTA patients compared to healthy controls. Blue areas indicate brain areas of reduced functional connectivity to the PCC in PTA patients compared to healthy controls. Results are overlaid on the MNI152 T1 1 mm brain template. (E) Voxels showing greater functional connectivity with a DMN-specific time-course in an independent cohort of patients following TBI (Sharp et al., 2011). (F and G) Graphs representing PCC functional connectivity changes in precuneus/parietal cortex and vmPFC. The precuneus/parietal graph is presented for visualization purposes alone. Ant. = anterior; TBIC = TBI controls. The colour bar represents P-values in the range of 0 to 0.05. All connectivity maps are significant at P < 0.05, family-wise error (FWE) except for the area of reduced functional connectivity in blue. This is displayed at an uncorrected threshold. *Significance at P < 0.05. Error bars represent the standard error of the mean (SEM).
