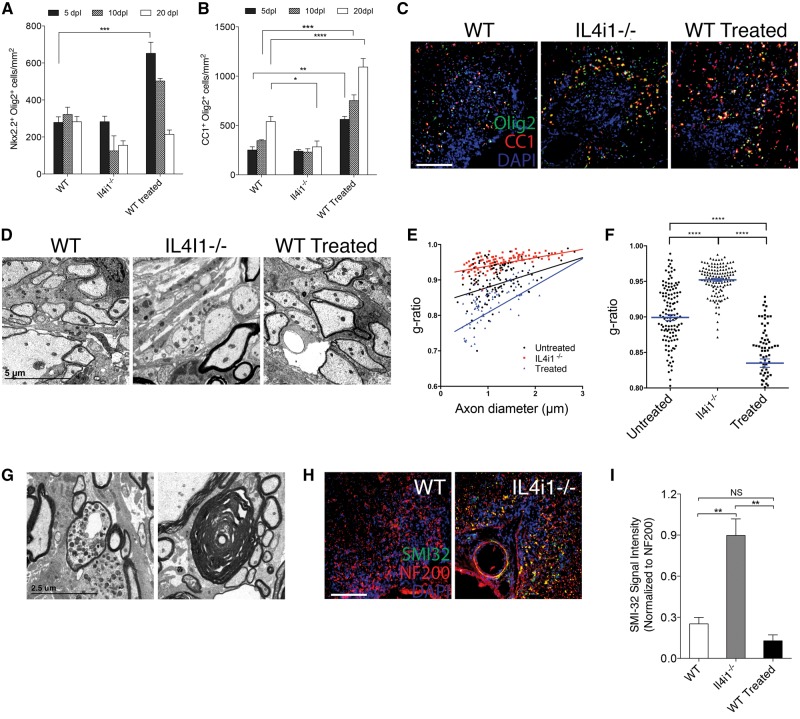
Figure 4.
IL4I1 regulates remyelination and preserves axonal integrity. Quantification of (A) Nkx2.2+Olig2+ and (B) CC1+Olig2+ cells per mm2 in lesions at 5, 10 and 20 dpl in wild-type (WT), Il4i1−/− and IL4I1-treated mice. (C) Immunostaining of Olig2 (green), CC1 (red) and DAPI (blue) in lesions at 10 dpl. Lesions are characterized as the cluster of DAPI+ nuclei in the spinal cord ventral funiculous. (D) Electron micrographs of lesion at 10 dpl show reduced remyelinated axons in Il4i1−/− lesions, and increased remyelinated axons in IL4I1 treated lesions compared to wild-type. (E) G-ratio analysis of remyelinated axons and corresponding axonal diameter. (F) Scatter plot showing the overall g-ratio in the mouse groups. (G) Electron micrographs of lesions in Il4i1−/− mice showing a dystrophic axon and an axon that has undergone Wallerian degeneration. (H) Immunostaining of SMI-32 (green), NF200 (red) and DAPI (blue) in spinal cord lesions at 10 dpl. Axonal dystrophy is detected by SMI-32+NF200+ co-labelling. (I) Graph of relative SMI-32 signal intensity normalized to NF200. For cell counts and fluorescence intensity, n = 3–5 mice per group were used and n = 3 ×10 magnification images per mouse were analysed. Scale bar = 100 μm for immunofluorescence images. *P < 0.05, **P < 0.01, ***P < 0.001, ****P < 0.0001; ANOVA followed by post hoc analysis.

