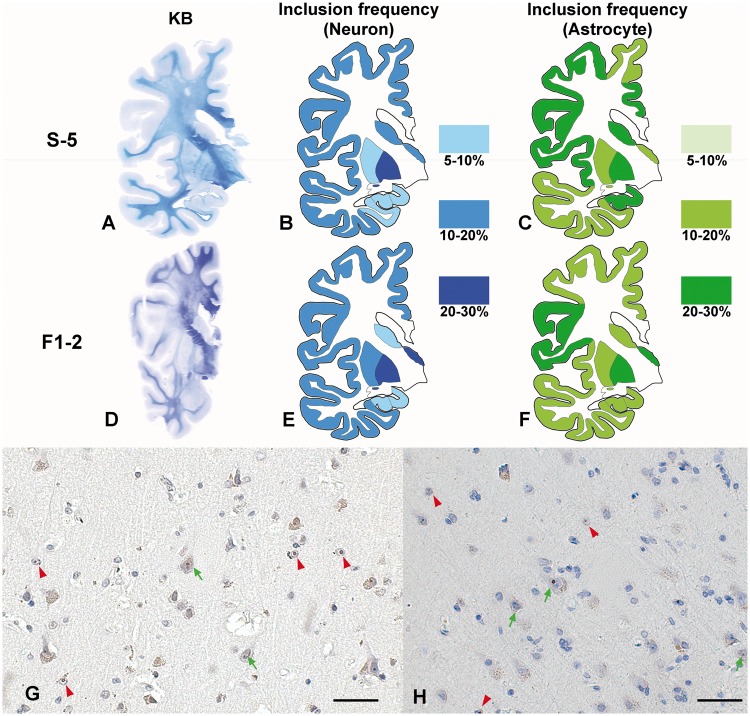
Figure 3.
Frequency of intranuclear inclusion in the NIID brain. (A–C) Sporadic NIID Subject S-5. (D–F) Familial NIID case Subject F1-2. (A and D) Klüver-Barrera stain of coronal section of cerebral hemisphere. White matter of frontal lobe in both samples showed evident demyelination. (B, C, E and F) Schematic diagrams of frequency and distribution of intranuclear inclusion of neurons (B and E) and astrocytes (C and F) in cerebral cortex, basal ganglia and hippocampus. Frequencies were assessed in serial section of Klüver-Barrera slide with immunohistochemistry with anti-p62 antibody. In Subject F1-2, hippocampus was not included in large coronal section, we analysed frequencies with other hippocampus slide separately. (G and H) p62 immunostaining of cerebral cortex of frontal lobe of Subjects S-5 (G) and F1-2 (H). Green arrow shows intranuclear inclusion positive neuron and red arrowhead shows intranuclear inclusion positive astrocyte. Scale bar = 50 μm.

