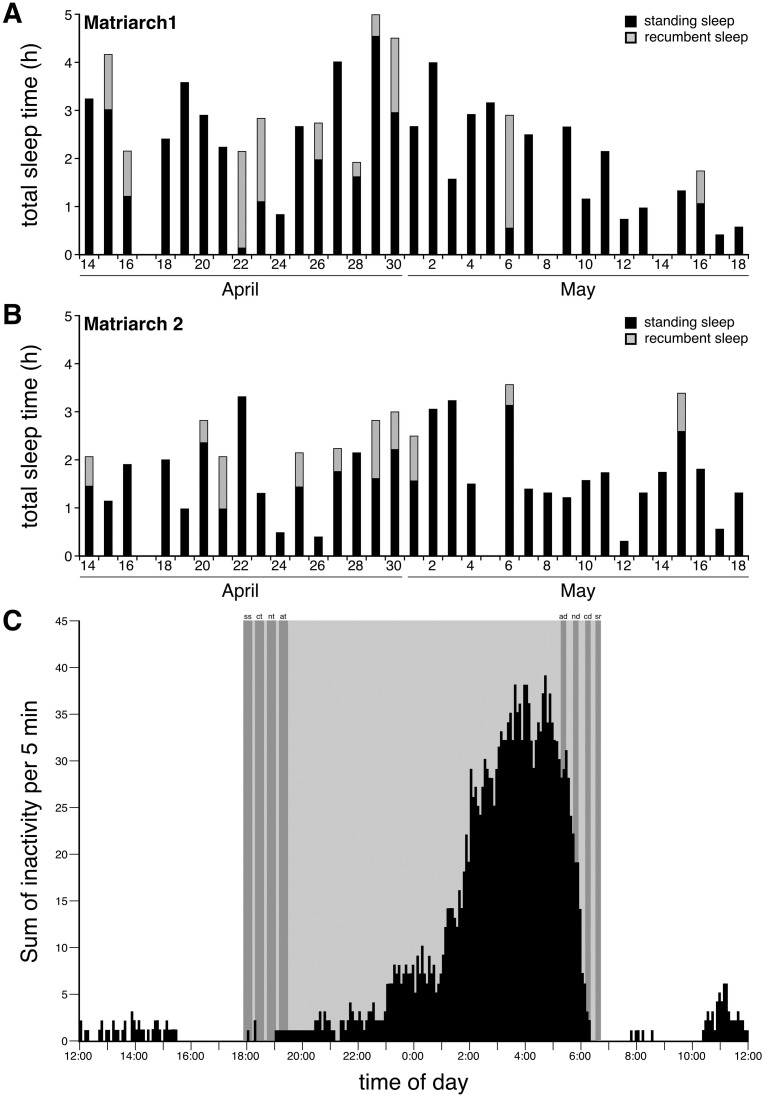
Fig 3. Sleep times, episodes and timing in the elephant.
A and B. Bar graphs representing total sleep time on each day through the 35-day recording period for each elephant, A–Matriarch 1, B–Matriarch 2. Note that on certain days no sleep was observed. The bars also represent the amount of time spent in standing sleep (black) and in recumbent sleep (grey), although recumbent sleep did not occur on each day. C. Graph illustrating the average count of inactivity/sleep episodes for any given 5 min period scored over the 35 day recording period and combining the data from both elephants. Note the clearly nocturnal pattern of inactivity, with little inactivity occurring during the daytime. The vast majority of sleep episodes occurred in the early morning during the hours of 02:00 and 06:00 (see also Fig 2). The grey region represents the period between sunset (ss) and sunrise (sr). astronomical dawn–ad, astronomical twilight–at, civil dawn–cd, civil twilight–ct, hour–h, nautical dawn–nd, nautical twilight–nt.

