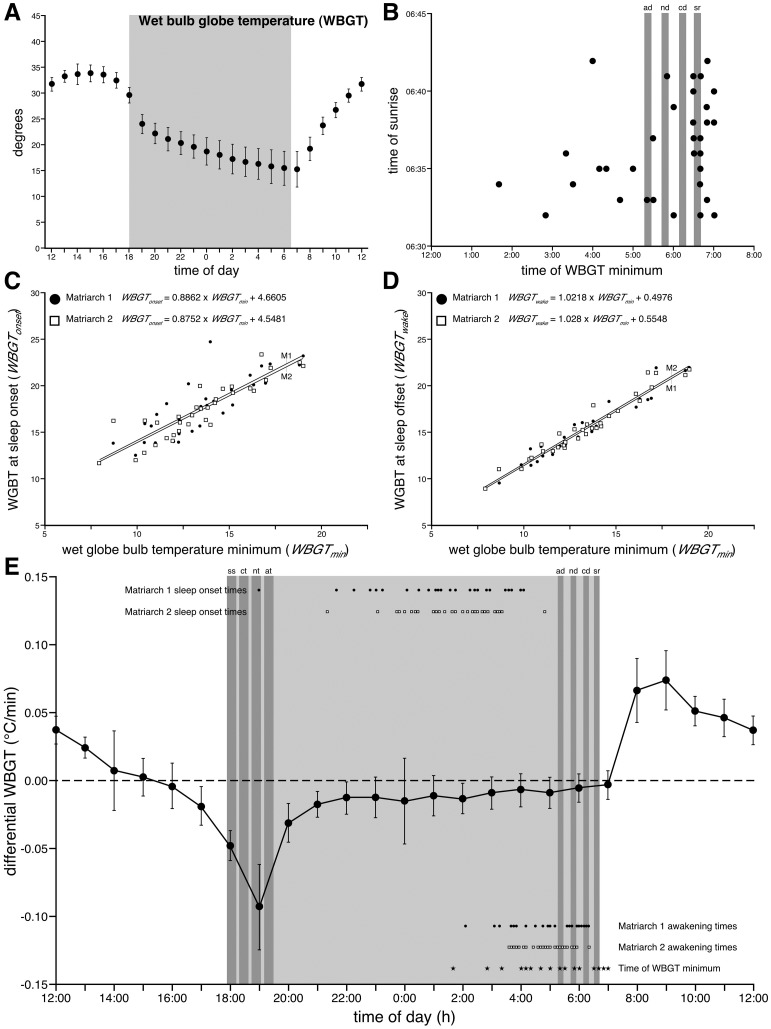
Fig 4. Wet globe bulb temperature and sleep in elephants.
Graphs showing the relationships between wet globe bulb temperatures (WBGT) and the timing of sleep onset and offset/awakening in the two elephants studied. A. This graph shows the hourly averages (with the bars representing 1 standard deviation) for WBGT during the 35-day recording period. The grey region represents the period between sunset and sunrise. B. This graph depicts the relationship between the timing of the minimum WBGT and the various dawn times (dark grey bars), including sunrise (sr), civil dawn (cd), nautical dawn (nd) and astronomical dawn (ad). C. Graph representing the statistically significant linear relationships between minimum WBGT (WBGTmin) and WGBT at sleep onset (WBGTonset) for both elephants (Matriarch 1 –M1; Matriarch 2 –M2). D. Graph representing the statistically significant linear relationships between minimum WBGT (WBGTmin) and WGBT at sleep offset/awakening (WBGTwake) for both elephants. E. Graph showing the relationships between the hourly changes in WBGT averaged over the 35 day recording period, the daily sleep onset and awakening times for both elephants, the timing of the daily minimum of WBGT, and the specific sunset (including sunset–ss, civil twilight–ct, nautical twilight–nt, and astronomical twilight–at) and sunrise times. Note that sleep onset, time of sleep and sleep offset/awakening all occurred during the period when the WBGT was slowly dropping, and do not coincide with the rapid periods of cooling (around sunset) or warming (after sunrise).

