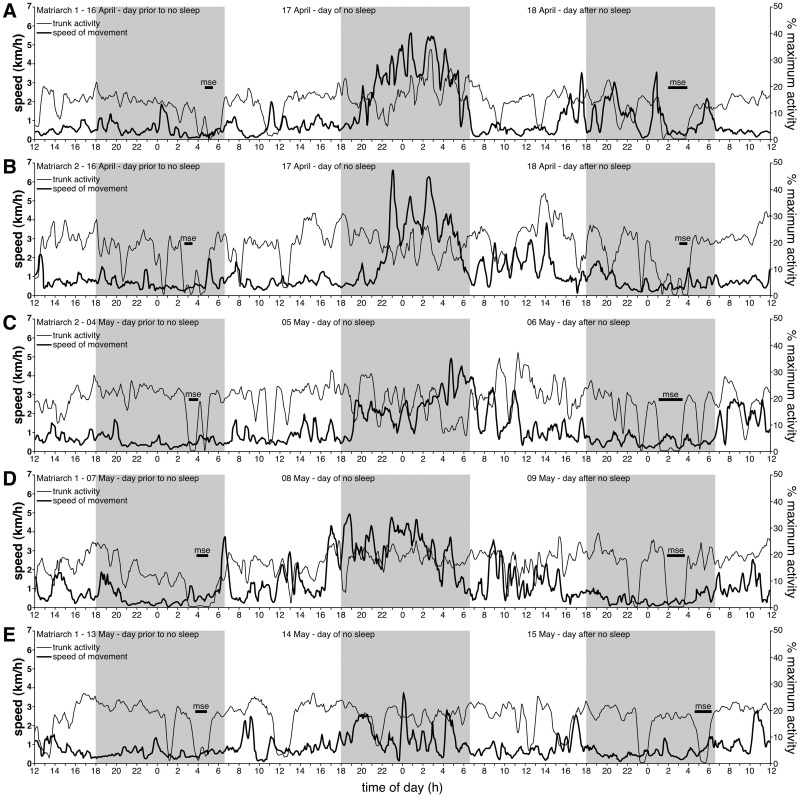
Fig 5. Days without sleep.
Line plots of trunk activity (calculated as percent of maximum activity to allow direct comparison between animals, thinner line) and speed of whole body movement (calculated as distance between subsequent GPS locations divided by time in kilometres per hour, km/h, thicker line) over the day prior to the day with no sleep, the day of no sleep and the day following no sleep, for the five occasions when this occurred during the recording period. The three grey regions in each plot represent the three periods between sunset and sunrise incorporated into these plots. The plots provided are of 15 minute moving averages, which highlight the periods (and reduce the noise of the raw data) of increased and sustained bodily and trunk activity when the elephants would have been predicted to be sleeping (see Figs 2 and 3). (A) Matriarch 1 16–18 April, (B) Matriarch 2 16–18 April, (C) Matriarch 2 04–06 May, (D) Matriarch 1 07–09 May, and (E) Matriarch 1 13–15 May. mse–main sleep episode, with the horizontal bar length representing the duration of the episode.

