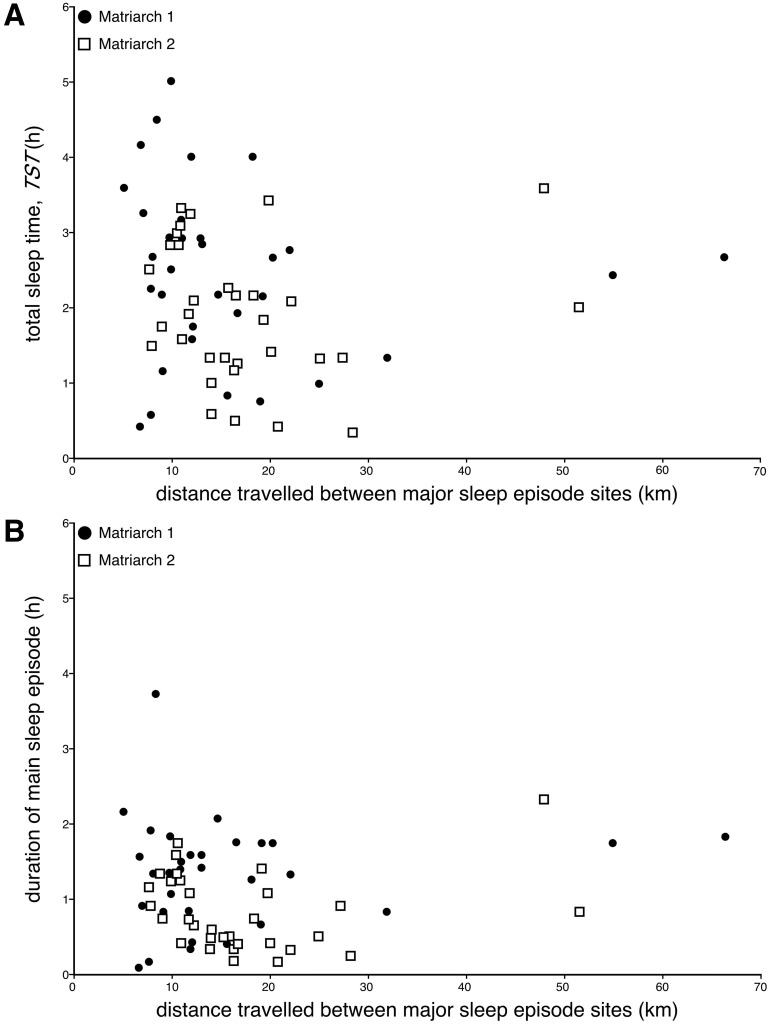
Fig 8. Sleep times and distance travelled.
Scatterplots showing the lack of a relationship between distance travelled between the sites of the main sleep episodes (kilometres, km) and total sleep time (TST, hours, h) (A) or duration of the main sleep episode (hours, h) (B) for both Matriarch 1 (closed circles) and Matriarch 2 (open squares). While there is a trend for shorter sleep times with increased distance travelled, these trends are not statistically significant even when the days without sleep are removed from the analysis. These plots demonstrate that prior activity does not appear to affect sleep times.

