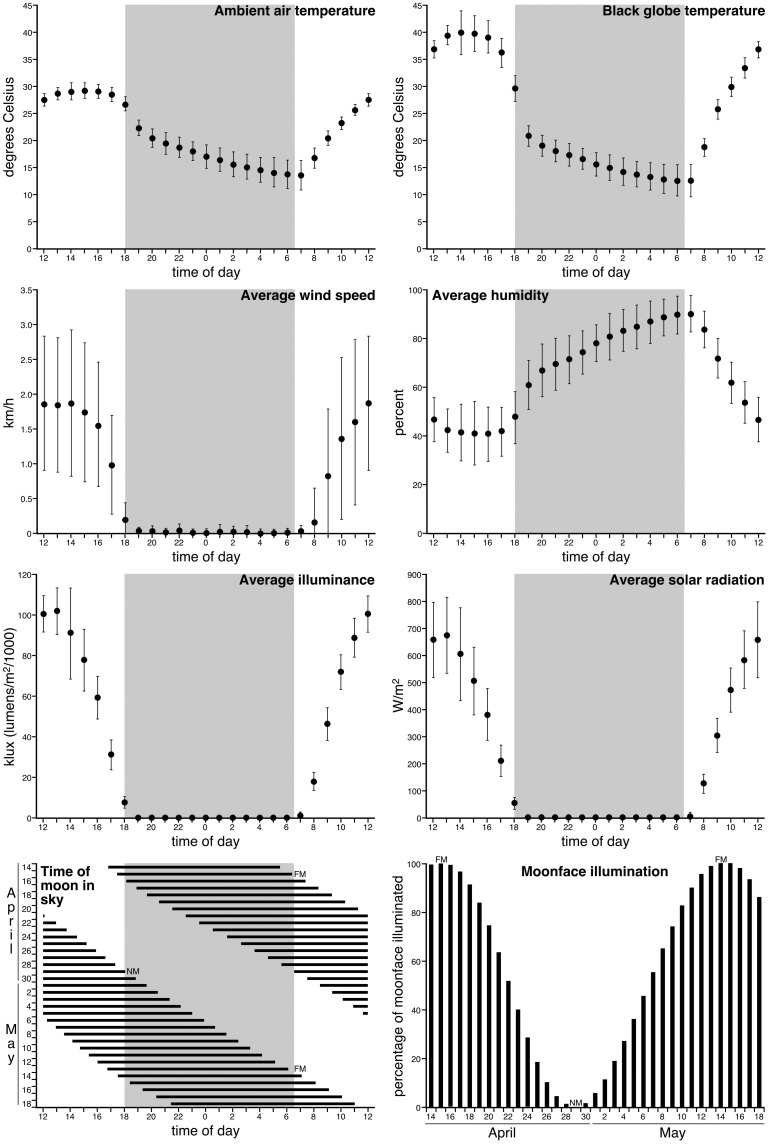
Fig 10. Weather parameters during the recording period.
During the recording period no extreme weather conditions were encountered. The upper six graphs in this figure show the hourly averages (with the bars representing 1 standard deviation) for the 35-day recording period. The grey regions represent the period between sunset and sunrise. km/h–kilometres per hour; m2 –metres squared; W/m2 –watts per metre squared. The lower two graphs represent the time the moon was in the sky (black horizontal lines) in relation to sunset and sunrise and the percentage of the face of the moon that was illuminated by the sun. FM–full moon; NM–new moon.

