
Figure 2.
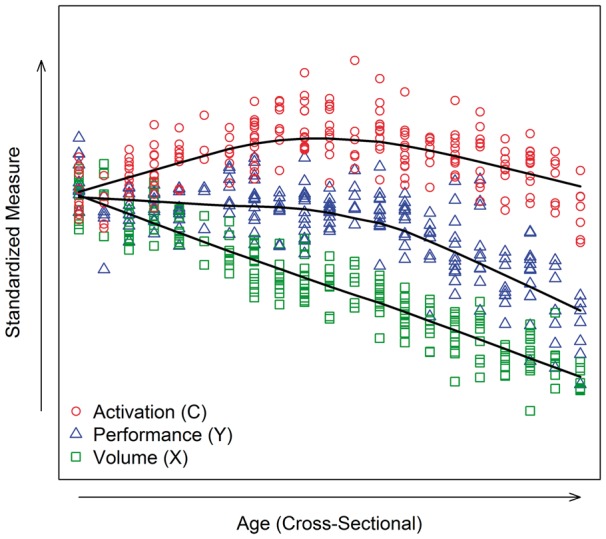
Visualization of simulated cross-sectional data (n = 200) with three key variables (activation, volume, performance). Scatterplot of values by age, with age being measured at only one time point per person. The measures were standardized to have the same mean at the first age. The smooth lines are based on a local polynomial smoother applied separately for each measure.