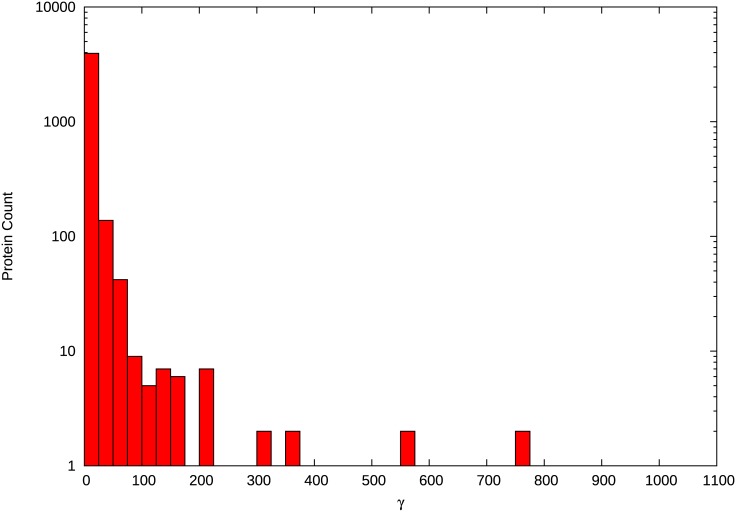
Fig 3. Distribution of the change in protein-protein interaction across the phylogeny.
The distribution of γ, which represents the total number of interaction changes (gains or losses) over the entire phylogeny. The majority of proteins experience relatively few changes in interaction across the phylogeny with a small number of proteins experiencing many changes.

