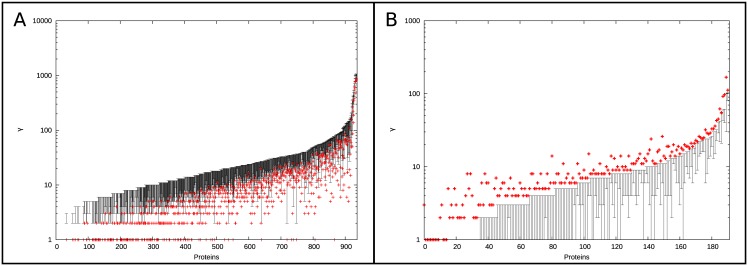
Fig 5. Proteins which experience a lower or higher number of changes in PPIs in the real data compared to the simulated interactomes.
Proteins which experience a lower (A) or higher (B) number of changes in inferred PPIs in the real data in comparison to the simulated interactomes. Each protein’s real γ is plotted in red and the range of γ observed in the null model are plotted in black.

