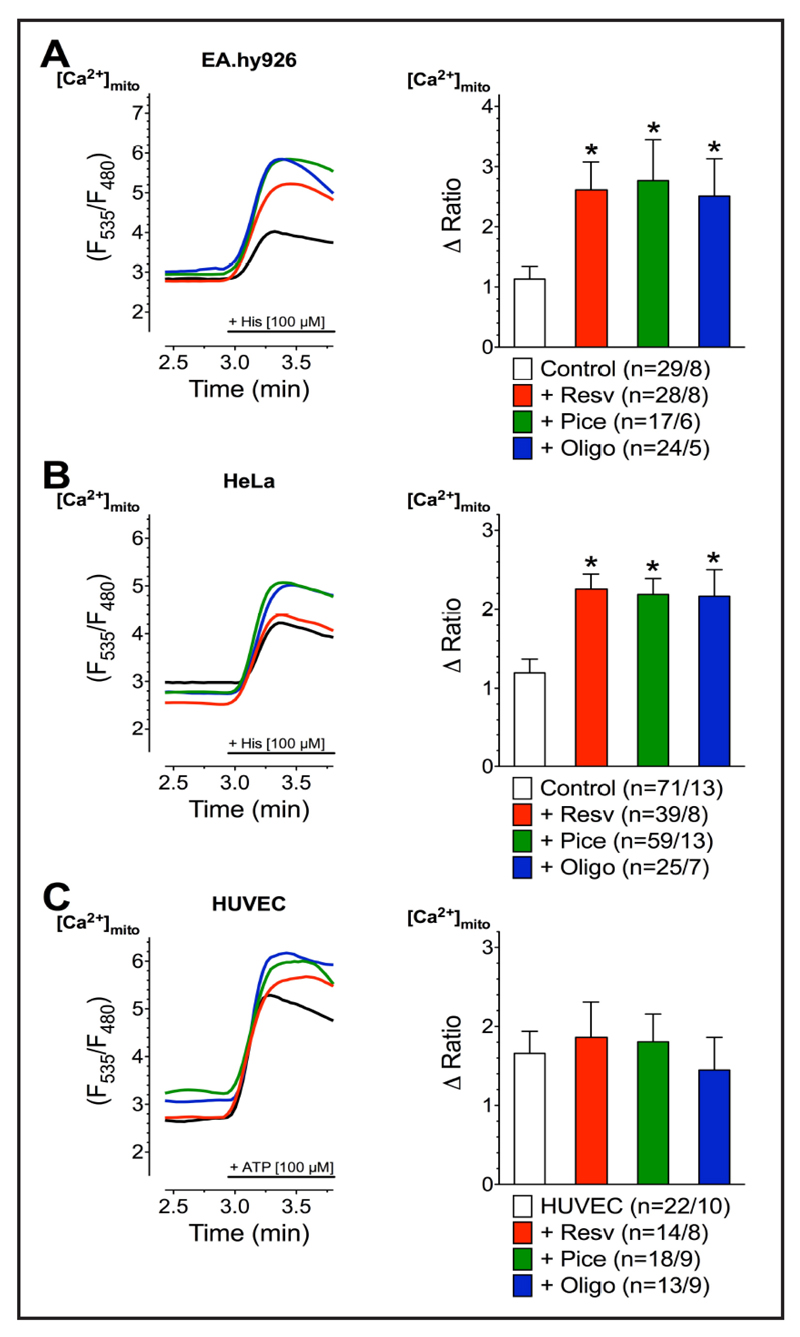
Fig. 2.
Representative curves (left panels) reflect mtCa2+ ratio signals over time of EA.hy926 (A), HeLa (B), and HUVEC cells (C), expressing 4mtD3cpv, in response to IP3 generating agonists measured in Ca2+-free solution under control conditions (black curve) as well as after 3 min incubations with 100 µM resveratrol (red curve), 100 µM piceatannol (green curve), or 10 µM oligomycin A (blue curve). To induce Ca2+ release from intracellular ER, 100 µM histamine (His) was applied to HeLa and Ea.hy926 cells, whereas 100 µM ATP was used as an agonist for HUVEC cells. Bars (right panels) represent an average of maximal ∆ ratio signals (mean ± SEM) upon IP3 generating agonist stimulation in Ca2+-free solution under control conditions (white columns; EA.hy926: n=29/8, HeLa: n=71/13, and HUVEC: n=22/10) as well as of cells treated with resveratrol (red columns; EA.hy926: n=28/8, HeLa: n=39/8, and HUVEC: n=14/8), piceatannol (green columns; EA.hy926: n=17/6, HeLa: n=59/13, and HUVEC: n=18/9), or oligomycin A (blue columns; EA.hy926: n=24/5, HeLa: n=25/7, and HUVEC: n=13/9).

