Fig. 6.
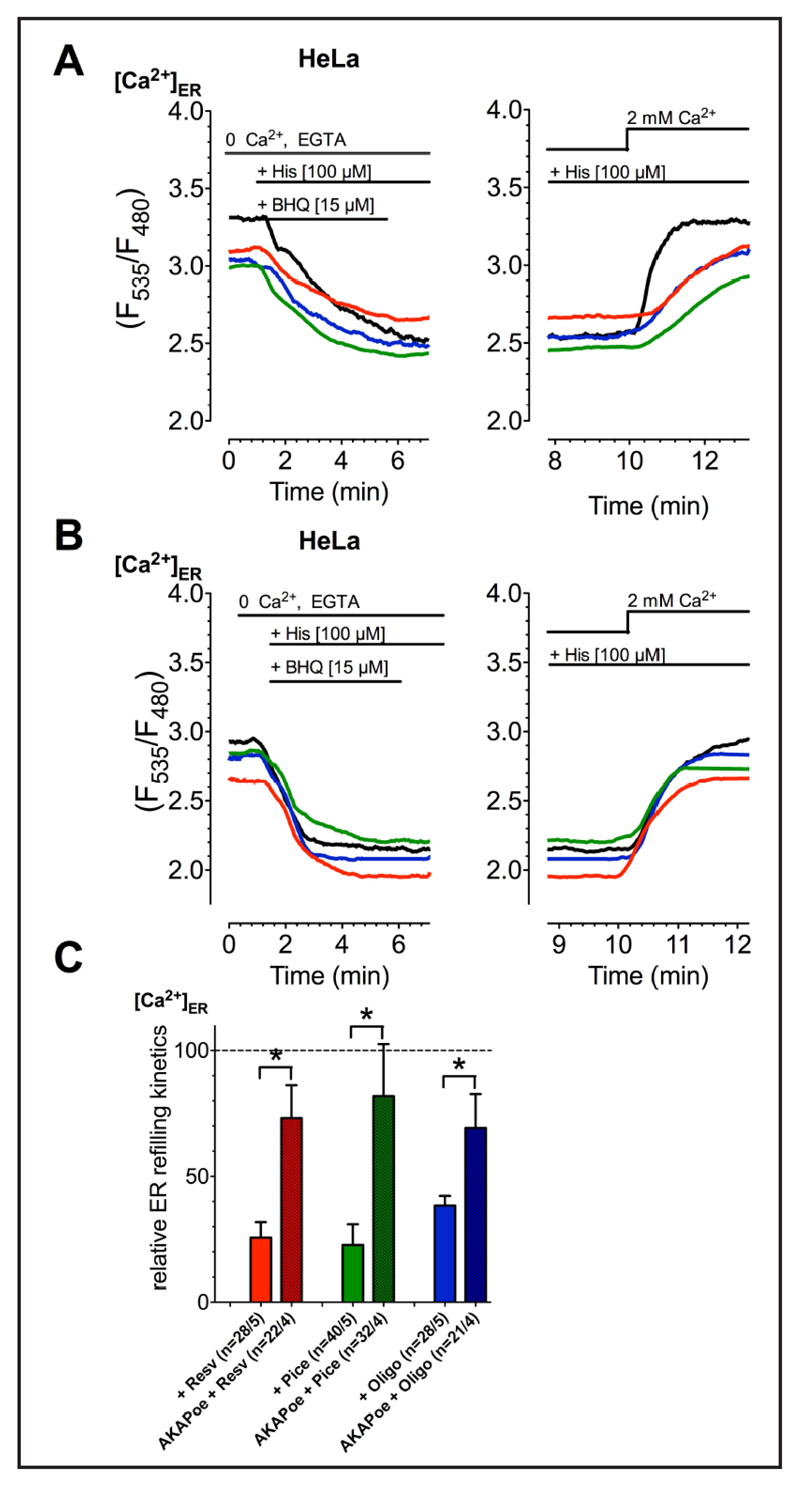
Representative curves reflect ERCa2+ ratio signals over time of HeLa cells without (A) or with (B) overexpression of AKAP-RFP-CAAX (AKAPoe), measured by D1ER. The ER Ca2+ store was depleted using 100 µM histamine (His) and 15 µM BHQ in Ca2+-free EGTA-buffered solution. Then the cells were incubated with compounds (resv: red curves, pice: green curves; oligo: blue curves) or kept in compund-free solution (black curves) and afterwards external Ca2+ [2 mM] was added. The slope of the cells‘ ERCa2+ uptake after 100 µM resveratrol (red columns; Resv: n=28/5, AKAPoe+Resv: n=22/4), 100 µM piceatannol (green columns; Pice: n=40/5, AKAPoe+Pice: n=32/4) or 10 µM oligomycin A (blue columns; Oligo: n=28/5, AKAPoe+Pice: n=21/4) incubation was normalized to corresponding control conditions and presented as percentage of ERCa2+ uptake slope of control (C).

