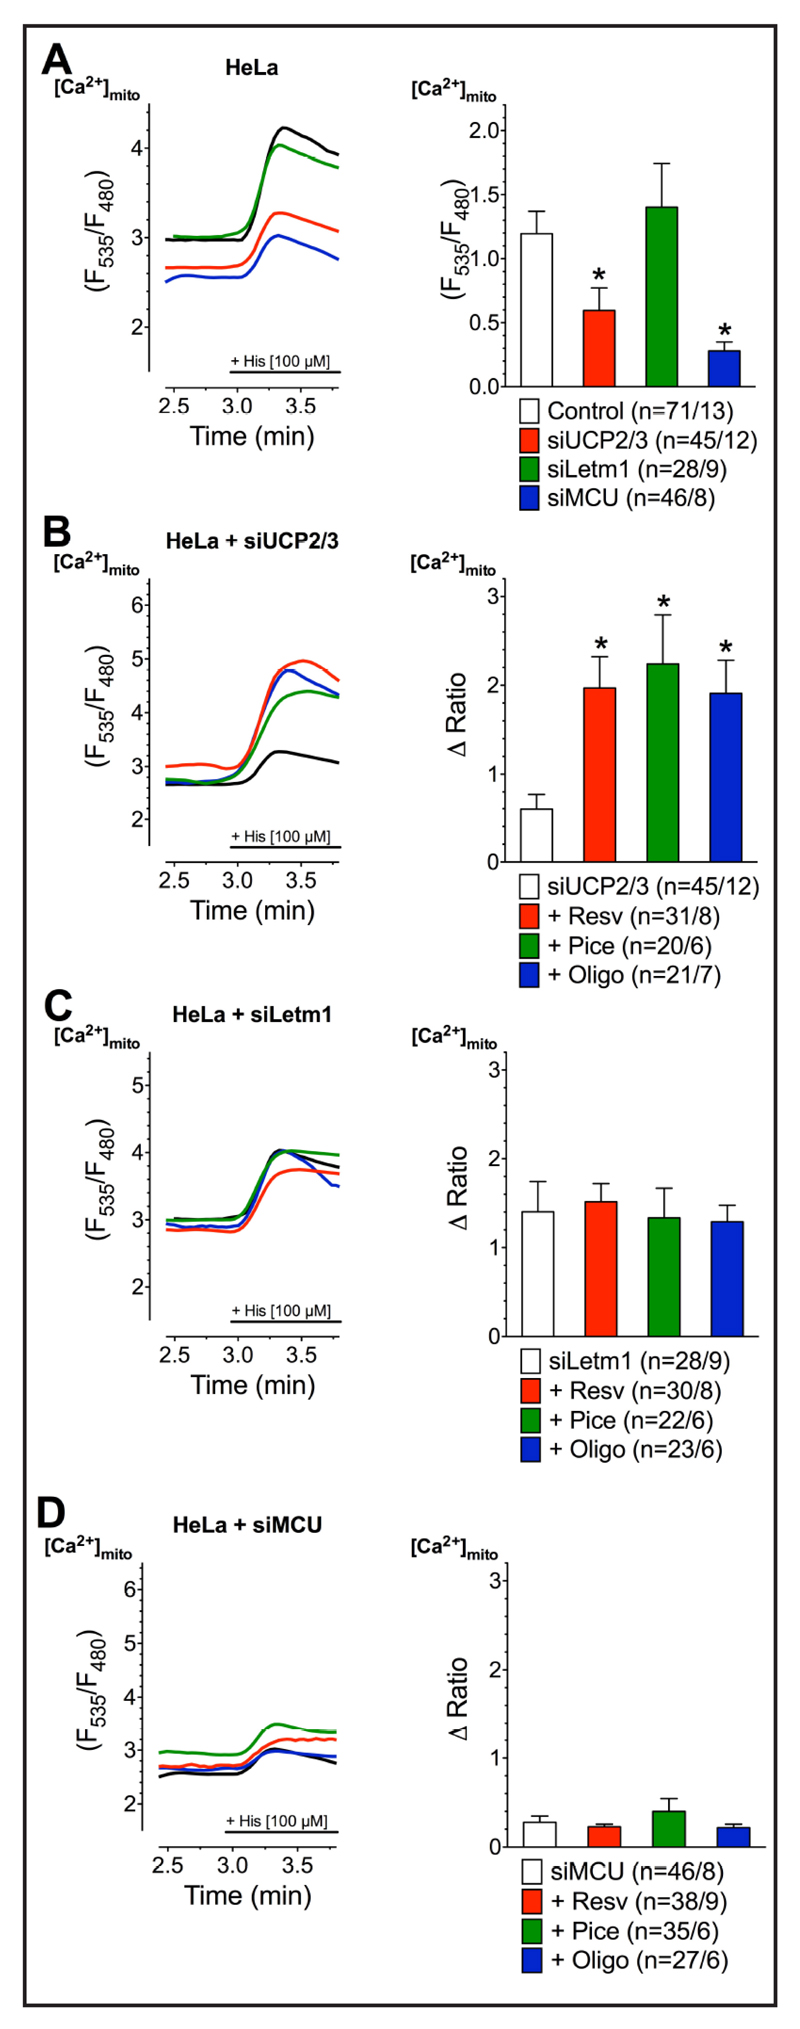
Fig. 7.
Representative curves (left panels) reflect mtCa2+ ratio signals upon 100 µM histamine (His) addition in Ca2+-free solution of HeLa cells with transient knockdown of UCP2/3 (A), Letm1 (B) or MCU (C) after treatment with 100 µM resveratrol (red curves), 100 µM piceatannol (green curves) or 10 µM oligomycin A (blue curves) as well as under control conditions with corresponding knockdown (black curves) or without knockdown (dotted lines). Bars (right panels) represent an average of maximal ∆ ratio signals of IP3 agonist stimulated response of cells without knockdown (dotted columns; n=71/13), under corresponding control conditions (white columns; siUCP2/3: n=47/12, siMCU: n =46/8, siLetm1: n=28/9) or after treatment with resveratrol (red columns; siUCP2/3: n=31/8, siMCU: n=38/9, siLetm1: n=30/8), piceatannol (green columns; siUCP2/3: n=20/6, siMCU: n=35/6, siLetm1: n=22/6) or oligomycin A (blue columns; siUCP2/3: n=21/7, siMCU: n=27/6, siLetm1: n=23/6).

