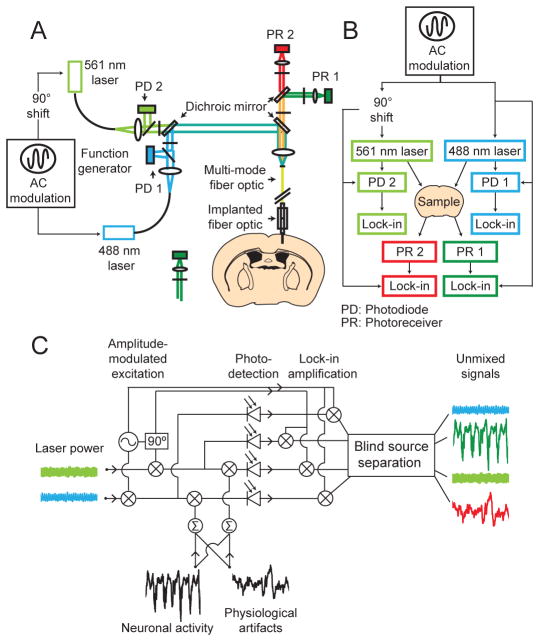
Figure 1. Instrumentation for optical voltage tracking.
(A) Optical schematic. Two single-mode lasers emit 488 nm and 561 nm light. Photodiodes (PD) track the fluctuations in the beams’ intensities. The beams are combined in a dichroic mirror and focused into a polymer-clad multi-mode optical fiber, which delivers the light to the brain via an implanted fiber. Fluorescence returns via this fiber, is split into red and green emissions, and is detected by photoreceivers (PR).
(B) Phase-sensitive detection scheme. To shift the detection band away from low-frequency electronic noise, we applied sinusoidal amplitude modulation to both laser beams, at either 900 Hz or 3.5 kHz, depending on the detection bandwidth. Lock-in amplifiers (Lock-in), each phase-referenced to the modulation, tracked the intensities of both beams and emission channels. To distinguish emissions excited by the two beams, the two beams’ modulations were 90° out of phase, which was thus also apparent in the emissions.
(C) Signal generation and unmixing. The green and red fluorescence signals reflect a mixture of neural activity, brain motion and hemodynamic artifacts, and are respectively multiplied by the blue and green illumination intensities, which vary due to laser power fluctuations and the sinusoidal modulations. A blind-source separation algorithm removes physiological artifacts and laser intensity noise from the neural activity traces. See also Figures S1, S2 and Supplemental Appendix 1.

