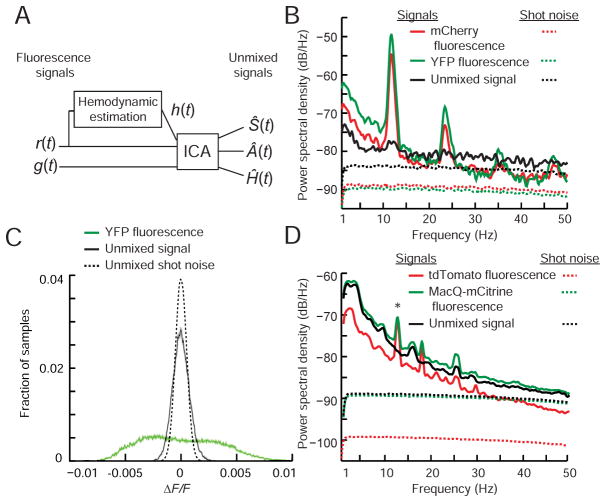
Figure 2. Blind source separation allows near shot-noise-limited measurement sensitivity.
(A) Blind source separation procedure. Green, g(t), and red, r(t), fluorescence traces, and an estimate of hemodynamic noise, h(t), are inputs to an independent component analysis (ICA). ICA unmixes these into statistically independent components, Ŝ(t), a voltage trace, brain motion artifacts, Â(t), and hemodynamic artifacts, Ĥ(t).
(B) Power spectra of intensity fluctuations from an unmixed 1-min recording in a freely moving mouse co-expressing YFP and mCherry. Both traces showed broadband power increases during mouse movement and prominent hemodynamic artifacts (fundamental frequency ± FWHM: 12 ± 0.3 Hz; second harmonic: 24 ± 0.8 Hz). However, across the detection band the power spectrum of the unmixed trace approached the theoretical sensitivity limits set by shot noise, as calculated in B and D for a source of stationary mean intensity subject to the same frequency-dependent sensitivity of photodetection as the actual signals (Supplemental Appendix 2). The ratio of the s.d. of the unmixed trace to that expected from shot noise was 1.5–1.6.
(C) Comparison of the distributions of fluorescence fluctuations, ΔF/F, in the YFP and unmixed signal traces to those expected from shot noise in the unmixed trace, for the mouse in B (N>104 time points). Unmixed signal traces from two YFP/mCherry mice had 20- and 10-fold reductions in noise power compared to raw YFP emissions. Shading denotes the s.e.m., computed based on counting errors, and is barely discernible.
(D) Power spectra of fluctuations of unmixed fluorescence traces from behaving mice expressing MacQ-mCitrine and tdTomato. Unmixing yielded significant 90 ± 4% (mean ± s.e.m.) declines in the peak power of hemodynamic noise (N=12 recordings from 4 mice; * denotes P=0.003, Wilcoxon signed-rank test).
See also Figure S3 and Supplemental Appendix 2.

