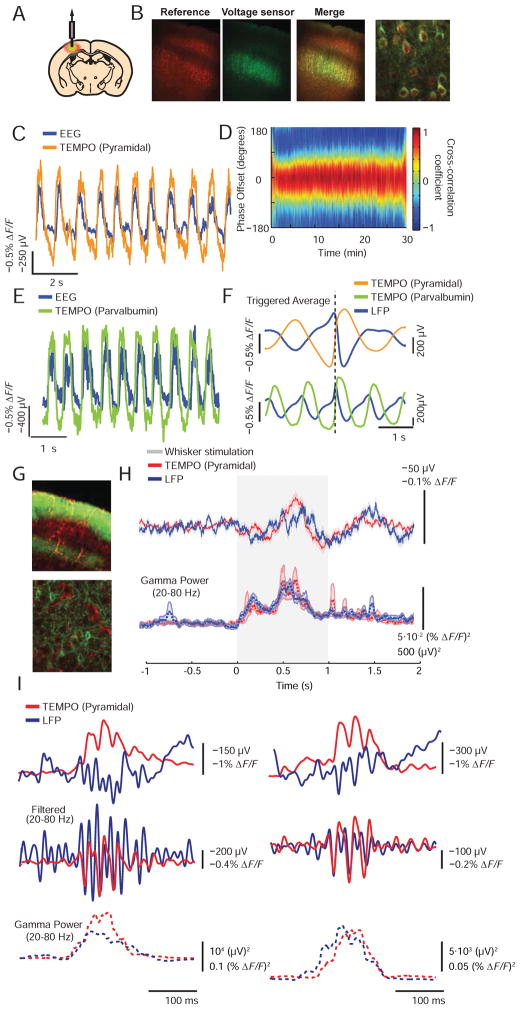
Figure 3. TEMPO reports voltage oscillations in anesthetized and alert mice.
(A) We virally expressed a green voltage sensor and a red reference fluor (AAV2/5-CaMK2a-MacQ-mCitrine; AAV2/5-CaMK2a-mCherry) in pyramidal cells in mouse infragranular somatosensory cortex. An overlying, implanted optical fiber delivered illumination and collected fluorescence.
(B) Green, red and merged dual-color fluorescence images of a coronal cortical section, and a magnified two-photon image of infragranular cells in the same section. Pyramidal cells throughout the cortex expressed mCherry. The voltage sensor was expressed in layers 5 and 6. Leftmost three scale bars: 100 μm. Right scale bar: 25 μm.
(C) EEG and TEMPO traces from cortical pyramidal cells in ketamine-xylazine (KX) anesthetized mice. The two time traces revealed low-frequency oscillations with similar waveforms.
(D) To assess the coherence of TEMPO and EEG oscillations, we computed the EEG–TEMPO cross-correlation in 4-s-increments across the 30-min session. It had a consistent peak amplitude and phase offset, showing the two traces had comparable dynamics over the session. We made similar findings as in B–D in N=4 mice.
(E) EEG and TEMPO signals from PV interneurons in mice under KX anesthesia. The two sets of time traces were often closely matched and revealed low-frequency oscillations. N=3 mice.
(F) Mean TEMPO and LFP traces relative to the transition of neurons from a hyperpolarized to a depolarized state in pyramidal cells and PV interneurons. Both cell types had similar, but significantly different temporal and phase offsets between the TEMPO and the LFP. (The polarity of the plotted LFP trace is the reverse of the EEG in C and E).
(G) An epi-fluorescence image of a coronal section from somatosensory cortex, and a two-photon image of cells in the same section reveal viral expression of a green voltage sensor (AAV2/9-CaMK2a-Ace2N-4AA-mNeon). The mouse (A2a-Cre × Ai14 tdTomato) expressed a red tdTomato reference fluor, which in cortex was largely confined to the vasculature. Similar expression in N=5 mice. Upper scale bar: 100 μm. Lower scale bar: 25 μm.
(H) TEMPO and LFP signals during bilateral tactile stimulation of the whiskers and ears. Upper, Mean TEMPO and LFP signals. Lower, Mean time courses of gamma-band (20–80 Hz) power. Both modalities showed a significant rise in gamma-band power during stimulation (P<10−10; Wilcoxon signed-rank test; N=389 stimulus trials in 5 mice). Shading denotes s.e.m. over trials.
(I) Single trial examples of gamma-band activity. Upper, Rises in gamma-band power typically occurred in 100–200 ms bursts, concurrent with depolarizations as seen in the TEMPO traces. Middle, Transient gamma-band bursts generally coincided in the two modalities. Lower, Time courses of gamma-band power were similar between the two modalities. See also Figure S4.

