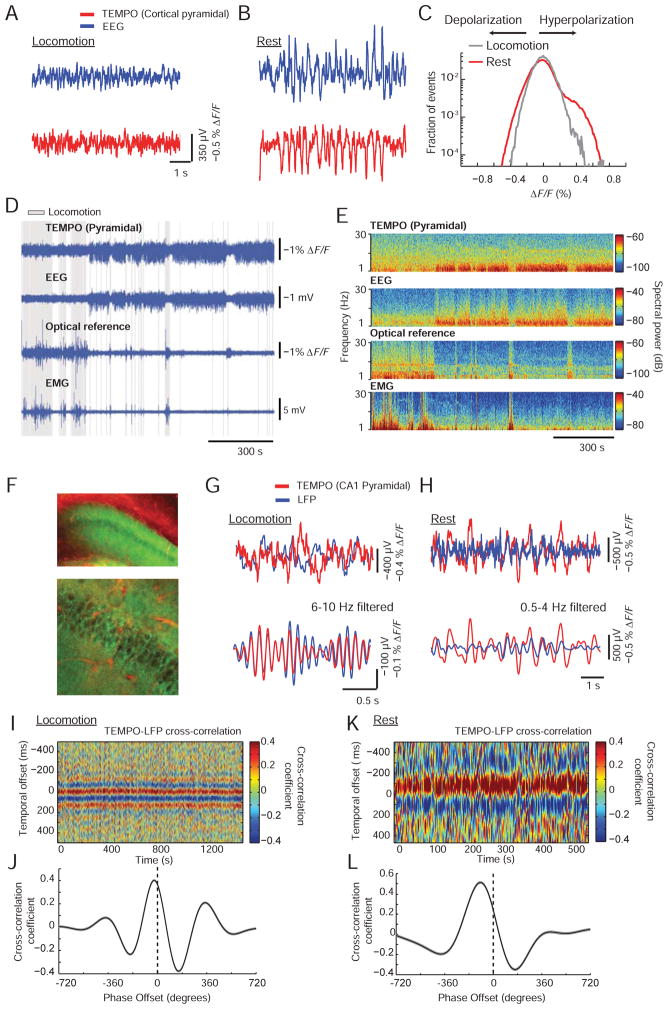
Figure 4. TEMPO reveals brain-state dependent voltage dynamics in active mice.
(A, B) EEG and TEMPO (somatosensory cortical pyramidal cells, labeled as in Figure 3B) traces taken during active behavior, A, and rest, B. Both recordings had increased variance during rest.
(C) Distributions of fluorescence changes, ΔF/F, during movement and sleep across the same TEMPO recordings as in A, B. The distribution during rest was skewed towards positive values, indicating pyramidal cells underwent coherent, population-level hyperpolarizations.
(D) TEMPO, optical reference, EEG and EMG signals from a behaving mouse during locomotion (gray shading), rest and sleep (both shown as un-shaded periods). During rest or sleep, TEMPO and EEG signals generally had increased amplitudes. The reference and EMG channels had larger amplitudes during locomotion.
(E) Spectrograms of the traces in D. TEMPO and EEG signals showed increases in the power of low-frequency oscillations during rest and sleep. Optical reference signals exhibited continuous 8–12 Hz oscillations consistent with cardiac pulsations. During locomotion, there were broad-spectrum power increases in the reference and EMG channels.
(F) We injected AAV2/9-CaMK2a-Ace2N-4AA-mNeon in the hippocampus of a mouse (A2a-Cre × Ai14 tdTomato) expressing tdTomato. Top, Epi-fluorescence image of a coronal section from hippocampal area CA1. Bottom, Two-photon image of cells in this section. CA1 pyramidal cells expressed the voltage sensor. Red fluorescence in CA1 was largely confined to the vasculature. Scale bars: 100 μm (upper) and 25 μm (lower).
(G, H) Upper, Raw and, Lower, narrow-band filtered time traces of LFP and TEMPO recordings during locomotion, G, and rest, H. The traces showed closely matched theta oscillations during locomotion. Delta-band activity during rest was less closely matched between the traces but still had consistent with phase relationships (K, L).
(I, J) Time-varying, I, and mean, J, cross-correlation functions between theta-band filtered (6–10 Hz) TEMPO and LFP traces during locomotion, showing consistent temporal and phase offsets over the 20-min session. (K, L) Time-varying, K, and mean, L, cross-correlation functions between unfiltered TEMPO and LFP traces during rest. TEMPO and LFP delta-band activity had consistent phase offsets across the 10-min sleep bout.
We made similar findings to F–L in N=3 mice.

