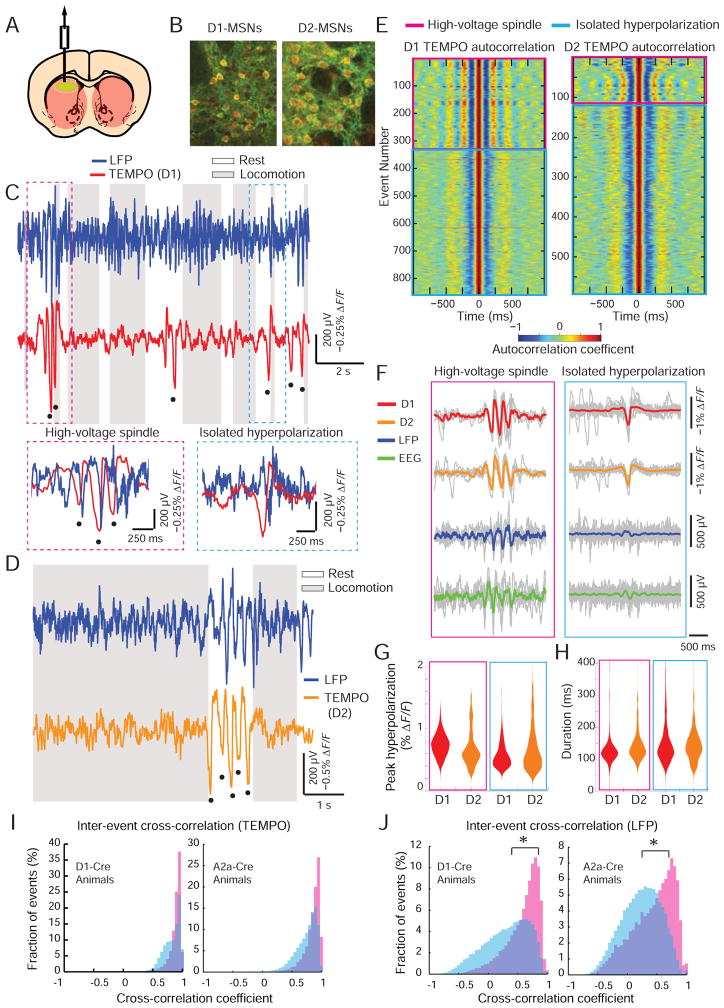
Figure 5. Striatal MSNs undergo population-level hyperpolarizations.
(A) To track activity in D1- or D2- MSNs, we injected AAV2/1-CAG-DIO-MacQ-mCitrine into the striatum of either D1-Cre or A2a-Cre mice.
(B) Dual-color, two-photon images of a striatal coronal section from a D1-Cre × Ai14 tdTomato mouse (left) and a A2a-Cre × Ai14 tdTomato mouse (right) show red neurons expressing the green sensor. Scale bar is 25 μm and applies to both panels (similar results in N=8 mice).
(C) LFP and TEMPO traces from a freely moving D1-Cre × Ai14 tdTomato mouse. Black dots in C and D mark hyperpolarization peaks in the TEMPO trace. Insets: Expanded views of the intervals in the red and blue dashed boxes.
(D) Example LFP and TEMPO traces from a freely behaving A2A-Cre × Ai14 tdTomato mouse, showing a high-voltage spindle during a pause in locomotion.
(E) Autocorrelation traces computed from TEMPO traces in D1- (left) and D2-MSNs (right); each row is for a separate hyperpolarization peak. High-voltage spindles underwent multiple cycles with similar time courses. Isolated hyperpolarizations exhibited lower-frequency oscillations and fewer cycles.
(F) Individual time-traces (gray) and mean time-traces (colored) of hyperpolarizing events in TEMPO traces from D1- and D2-MSNs, and in LFP and EEG recordings.
(G, H) Violin plots showing statistical distributions of the peak hyperpolarization, G, and temporal duration, H, of both event classes in D1- and D2-MSNs. White bars denote mean values.
(I, J) Distributions of cross-correlation values between waveforms for all pairs of high-voltage spindles (pink) and all pairs of isolated hyperpolarizations (cyan) in D1- (left panels) and D2-MSNs (right panels) in TEMPO (I) and LFP (J) recordings. The TEMPO values were generally nearer to 1, indicating greater stereotypy. * denotes P < 0.05, Wilcoxon rank-sum test. See also Figures S5 and S6.

