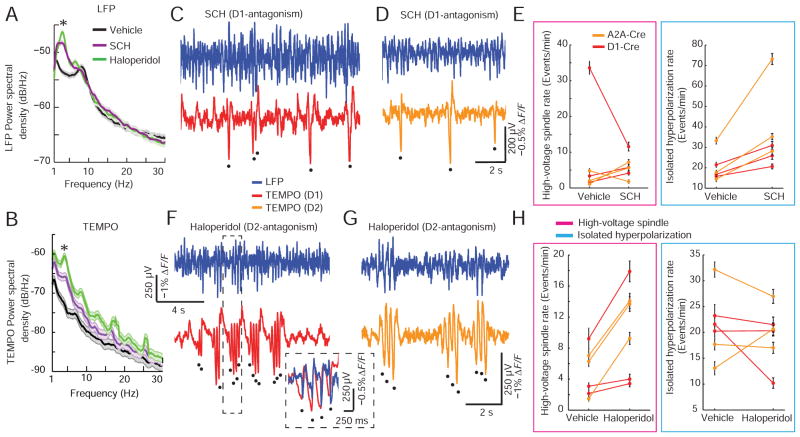
Figure 7. TEMPO, but not electric field potentials, reveals the different striatal states evoked by D1- and D2-antagonism.
(A, B) Power spectral densities of example LFP, A, and TEMPO, B, recordings after administration of saline vehicle, a D1-antagonist (SCH23390) and a D2-antagonist (haloperidol). Both antagonists evoked increased power in the 3–5 Hz band as compared to saline (comparison of 3–5 Hz power before vs. after drug administration; * denotes P < 0.05). Recordings began 15 min after injection and lasted 15–30 min.
(C, D) LFP and TEMPO traces from D1-Cre, C, and A2A-Cre, D, mice after injection (0.2 mg/kg i.p.) of SCH23390. Isolated hyperpolarizations were prominent in TEMPO but not LFP traces. We found no correlations between event rates determined using TEMPO and the time since drug injection (Table S1).
(E) Incidence rates of striatal events, after administration of saline vehicle or SCH23390. Lines denote individual mice. D1-antagonism significantly increased the incidence of isolated hyperpolarizations (P = 0.03) but not high-voltage spindles (P = 1.0), in both D1- and D2-MSNs.
(F, G) Example LFP and TEMPO traces in D1-Cre, F, and A2A-Cre, G, mice after injection of haloperidol (1 mg/kg i.p.). Inset: Expanded view of the interval in the dashed box.
(H) Rates of coherent striatal events after administration of saline vehicle or haloperidol. Lines denote individual mice. D2-antagonism significantly increased the rate of high-voltage spindles (P = 0.03), but not isolated hyperpolarizations (P = 0.47) in both D1- and D2-MSNs.
Black dots mark hyperpolarization peaks in the TEMPO traces. P-values calculated using Wilcoxon signed-rank tests in N = 6 mice. See also Figure S7 and Table S1.

