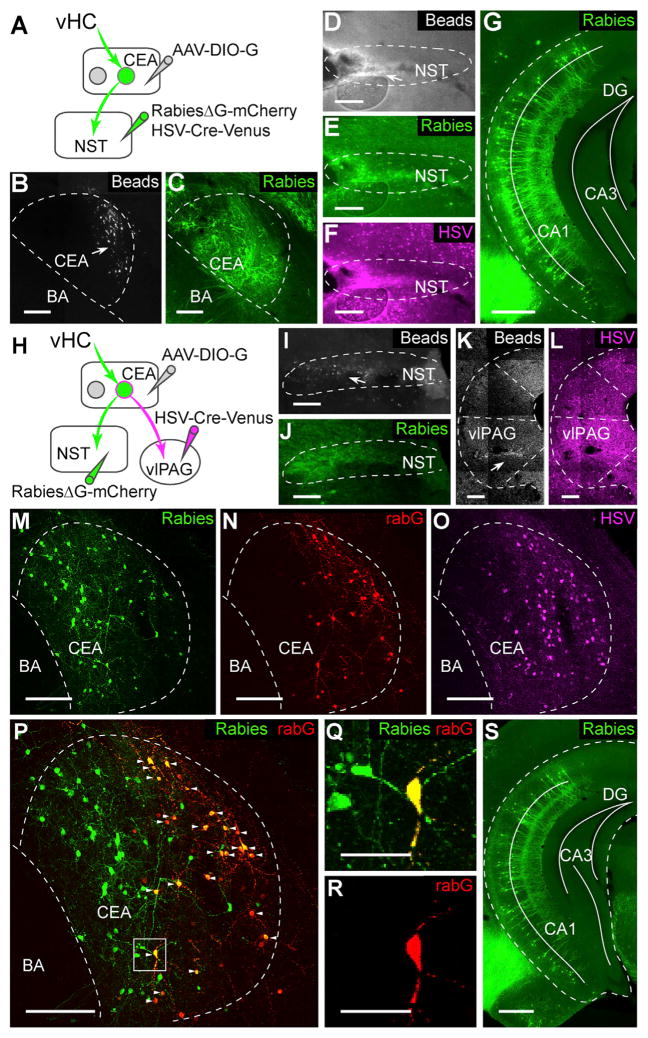
Figure 2. vHC Neurons Are Di-synaptically Connected to NST.
(A) Scheme illustrating experimental design used for trans-synaptic retrograde tracing from the NST.
(B) Example picture showing injection site injected with a mixture of AAV-DIO-G and beads (arrow).
(C) Example picture showing rabies infection in the CEA.
(D–F) Example pictures showing infections by rabies (E, green), HSV-Cre-Venus (F, magenta), and co-injected beads (D) in the NST.
(G) Example picture showing rabies-labeled cells in vHC after injections depicted in (A).
(H) Scheme illustrating experimental strategy used for trans-synaptic tracing of presynaptic inputs to CEA neurons projecting to both the NST and the vlPAG.
(I and J) Example pictures showing co-injection of rabies (J) and beads (I, arrow) into the NST.
(K and L) Examples for HSV infection (L) and co-injected beads (K, arrow) in vlPAG.
(M–P) Example pictures showing rabies-labeled neurons (green, M), immunostaining for rabG (red, N), HSV-Cre-Venus-labeled neurons (magenta, O), and the overlay (P) in the CEA. Arrows point to starter cells co-stained for rabies and rabG.
(Q and R) Magnification of boxed area in (P) displaying an identified starter cell.
(S) Example picture showing rabies-labeled cells in vHC after injections depicted in (H).
Scale bars, 500 μm (G and S) and 50 μm (Q and R); all other panels, 200 μm.
See also Figure S1.

