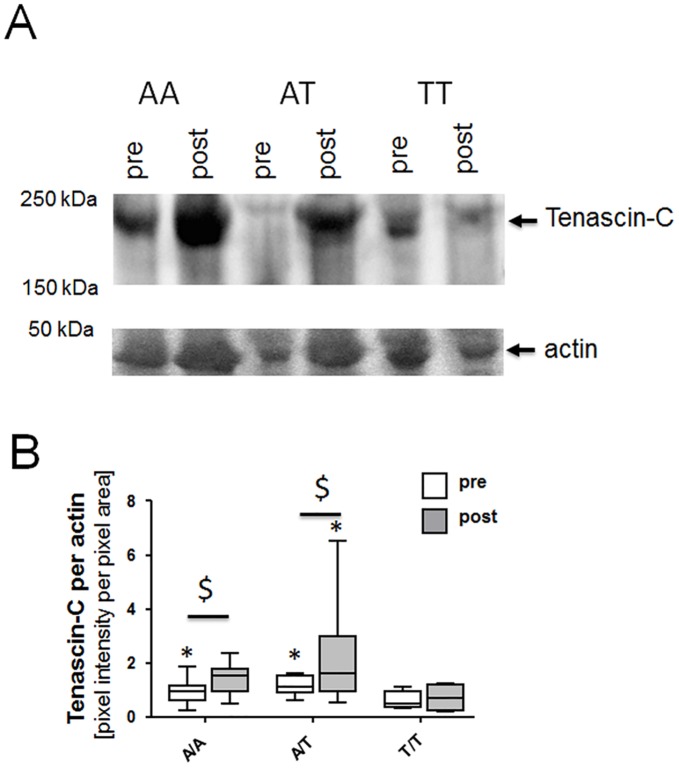
Fig 4. Tenascin-C protein in vastus lateralis muscle with endurance training.
(A) Immunoblot (Top part of panel) showing the detection of tenascin-C protein in the three rs2104772 genotypes before and after endurance training. The position corresponding to the large tenascin-C isoform at 230 kDa is indicated. The bottom part of the panel shows the corresponding actin band (loading control) on the Ponceau-S-stained membrane before immunoblotting. For image assembly see S2, S3 and S4 Figs. (B) Box whisker plot visualizing medians ± standard errors (central lines and boxes, respectively) and minima/maxima (whiskers) of actin-related Tenascin- content pre and post training in the respective genotypes. In total biopsies from 18 subjects were assessed: A/A (n = 4), A/T (n = 10), and T/T (n = 4). *, p < 0.05 vs. T/T pre; $, p < 0.05 vs. pre. ANOVA with Fisher’s post-hoc test.

