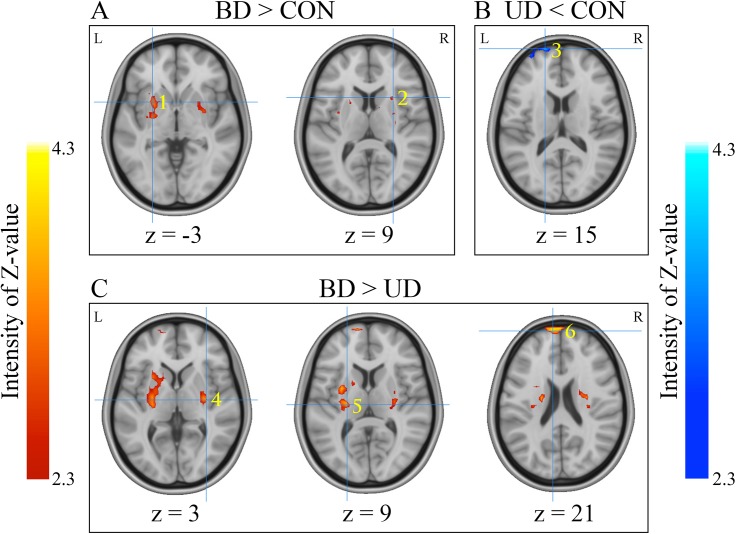
Fig 1. Regions showing significant differences in fALFF between each of the two groups.
(A) demonstrates regions showing group difference between the BD and CON groups, with the fALFF value increased in BD relative to the controls. (B) demonstrates the region exhibiting group difference between the MDD and CON group, with the fALFF value increased in the CON group relative to MDD.(C) demonstrates regions showing group difference between the BD and MDD groups, with the fALFF value increased in BD relative to MDD. The color bar means the intensity of Z-value, yellow/red in the color bar denotes relatively higher fALFF values, and cyan /blue in the color bar denotes relatively higher fALFF values. Locations of the clusters showing group differences were indicated by Arabic numbers labeled in each image. The number in the lower right corner of each image refers to the z MNI coordinates. Brain region labels: 1. left putamen; 2. right putamen; 3. left superior frontal gyrus/medial frontal gyrus; 4. right putamen; 5. left putamen; 6. left superior frontal gyrus. Left in the figure indicates the right side of the brain. BD: bipolar disorder. MDD: major depression. CON: control.

