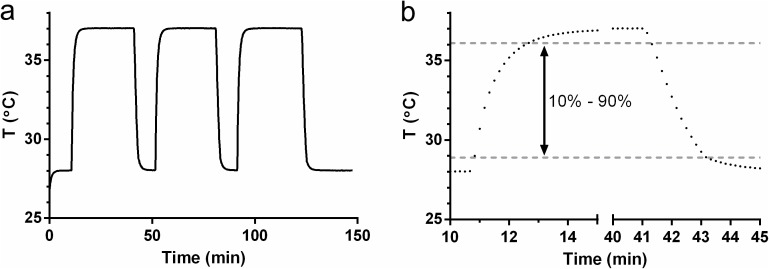
Fig 5. Adherence IVR temperature response analysis.
(a) Temperature measured by the thermistor as a function of time during three cycles of alternating between two controlled temperature chambers maintained at 28°C and 37°C, respectively. (b) Zoomed data for first cycle showing individual temperature readings collected at 10 s intervals. The lower and upper gray dotted lines indicate the values at 10% and 90%, respectively, of the full-scale measured temperature change.

