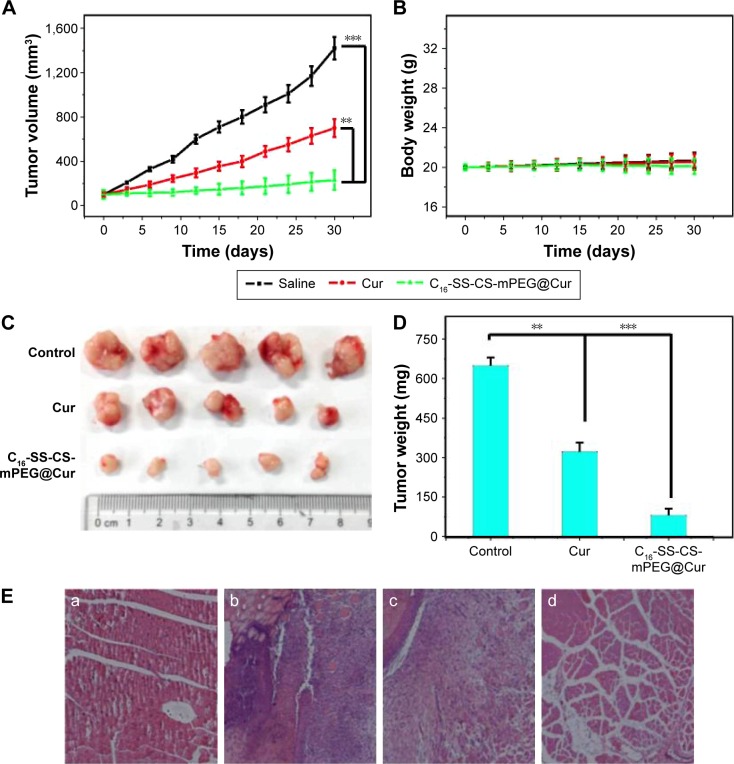
Figure 8.
Anti-cancer and anti-inflammatory effects in vivo.
Notes: (A) Tumor volumes at different times after treatment. (B) The average mouse body mass was monitored using an electronic balance every 3 days. (C) The images of dislodged tumors from the mice 30 days posttreatment. (D) The mass of dislodged tumors from the mice in all five groups. **P<0.01, ***P<0.001. (E) Hematoxylin and eosin-stained images of skin sections around tumors collected from (a) healthy control, (b) saline, (c) Cur, and (d) C16-SS-CS-mPEG@Cur-injected mice bearing MCF-7 tumors 30 days postinjection. Data are shown as mean ± SD (n=5).
Abbreviations: C16-SS-CS-mPEG, monomethoxy-poly(ethylene glycol)-chitosan-S-S-hexadecyl; Cur, curcumin; SD, standard deviation.

