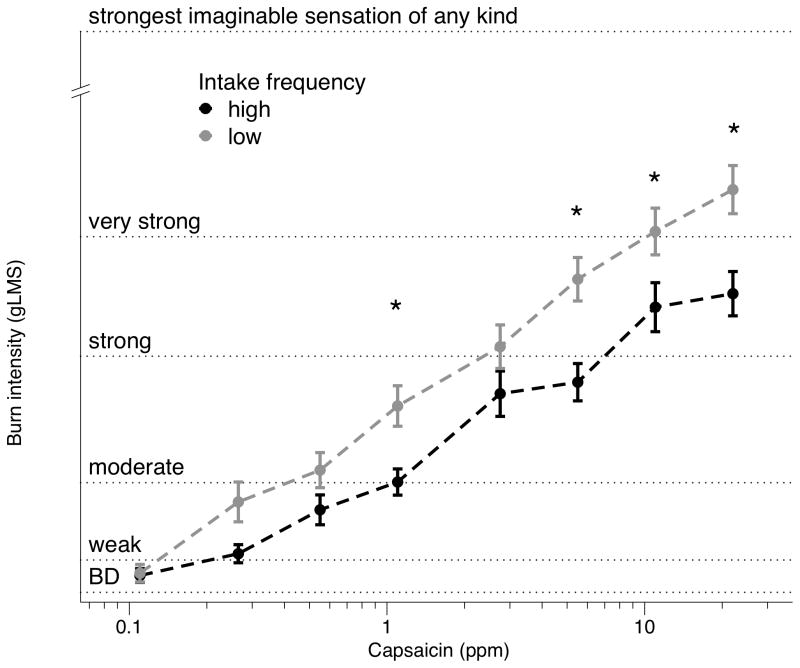
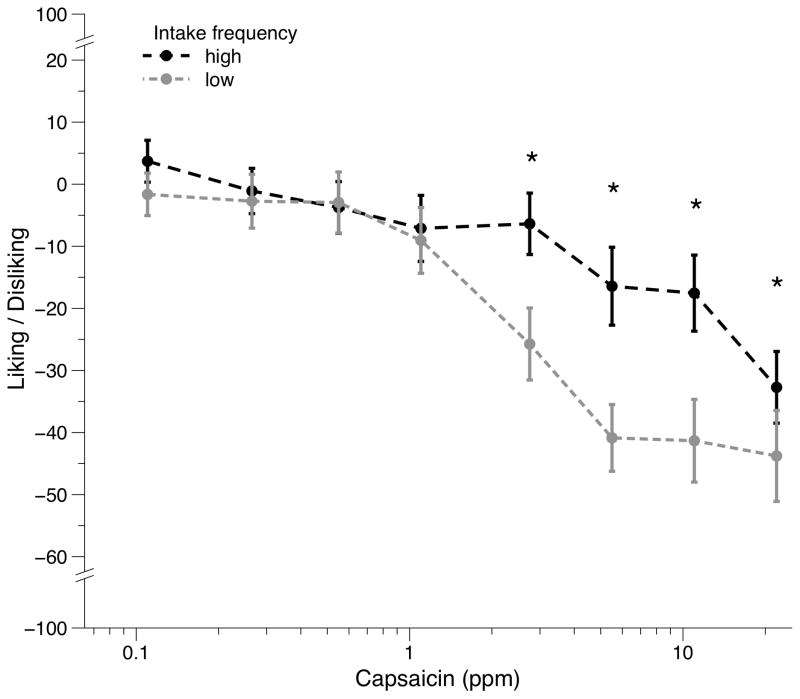
Figure 2.
(A) Same data as in Figure 1, but segmented by frequency of chili pepper consumption. The groups were formed using a median split of the summed annualized frequency for 5 different questions regarding pepper intake (hot sauce, chili peppers, habanero peppers, red pepper flakes, and spice mix containing chilies). (B) Group means and standard errors for hedonic ratings, segmented by intake frequency. See text for details of the ANOVA main effects and interactions. Stars indicate significant differences (p<0.05) between groups at that concentration.


