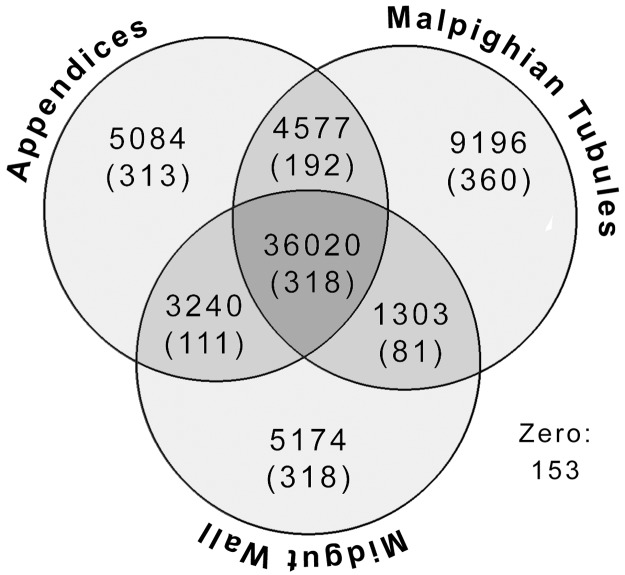
Fig 2. Venn diagram showing the distribution of transcripts in the tissue libraries.
The number of sequences differentially expressed (and, in parentheses, the number highly expressed) in the midgut “appendices,” Malpighian tubules, the midgut wall, and pairs of these tissues are given. The center shows the number of sequences equally expressed in all three tissues (meaning no differential expression), with the number highly expressed in all three tissues in parentheses. “Zero” indicates the 153 reads that Cufflinks could not map.

