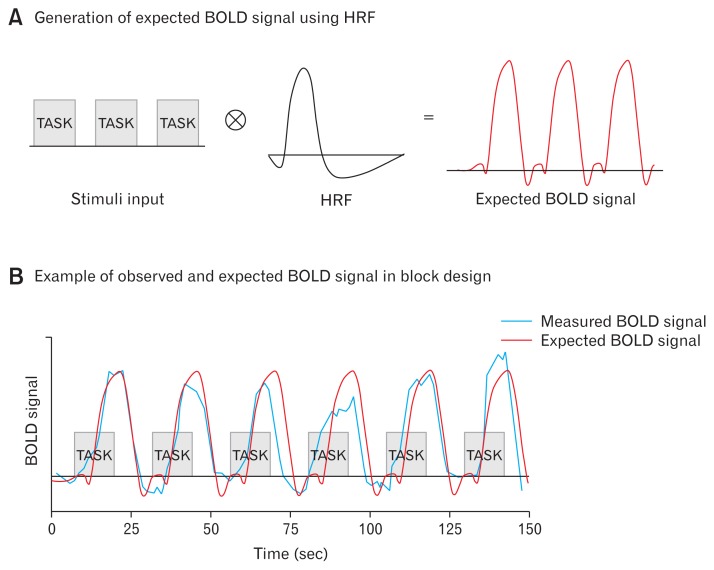
Figure 3.
Illustration of expected and measured blood oxygen level dependent (BOLD) signal from single voxel in task functional magnetic resonance imaging. (A) Example of expected BOLD signal using hemodynamic response function (red). (B) Illustration of measured BOLD signal in task-specific activated voxel (blue) and simulated BOLD signal (red) from (A). In the general linear model, the linear relationship between observed (blue) and expected BOLD signal (red) is estimated.

