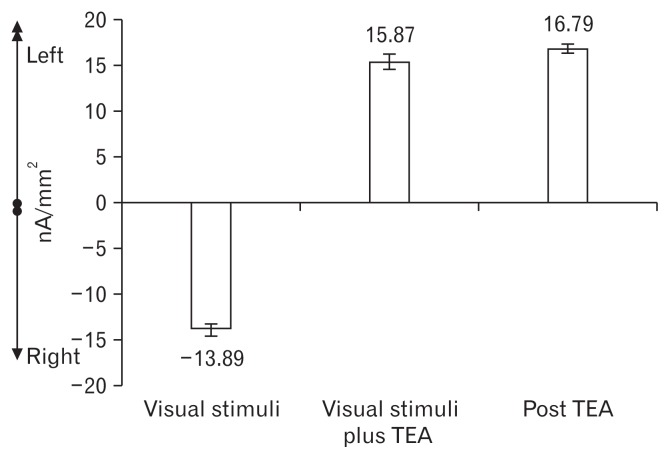
Figure 6.
Electroencephalography frontal asymmetry. Cortical slow potentials of frontal lobe sources were separated between left and right regional generators, and the area under the curve for the stimulation intervals was then computed and analyzed. A negative value indicates a right dominance, a positive value a left dominance.

