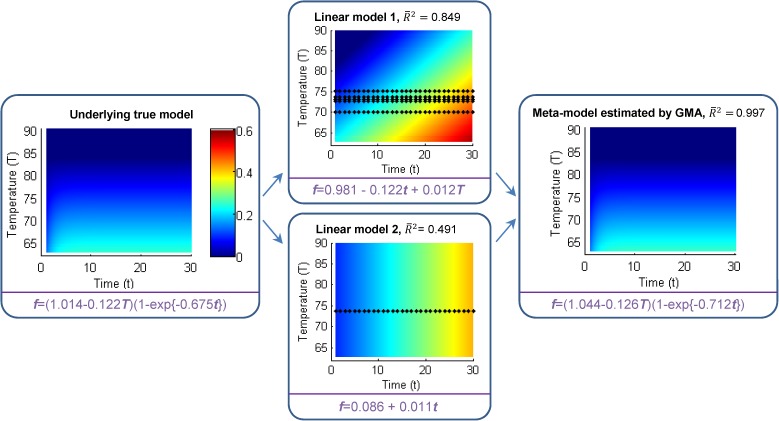
Fig 4. Comparison of two linear models and the nonlinear meta-model with the underlying true model.
The predicted outcome is fluid leakage rate and its expected value under the true data generating process (left), and each model is shown using color maps. Black dots in the two middle charts identify the original data points used in estimation of the two linear models. However, these “raw” data points are not used in GMA estimation, only the coefficients of the two linear models (3+2 coefficients) and two R2 terms (total of 7 signatures) are used for estimation of the non-linear meta-model (graphed on the right).

