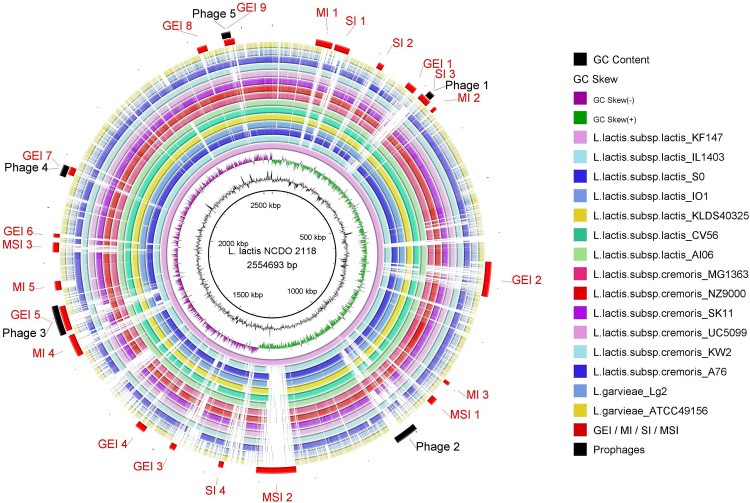
Fig 2. Circular comparison of the Lactococcus genus using L. Lactis NCDO 2118 as a reference.
Each ring of the circle corresponds to a specific complete genome represented in the legend on the right. The similarity between species is represented by the intensity of the color. Darker colors represent higher similarities than bright ones. Deleted regions are represented by blank spaces inside the circles. (GEI = Genomic Island; MI = Metabolic Island; SI = Symbiotic Island; MSI = Miscellaneous Island, harboring both metabolic and symbiotic factors). Genomic islands and phage sequences were predicted with GIPSy and PHAST, respectively. The circular genomic comparisons were created with BRIG.

