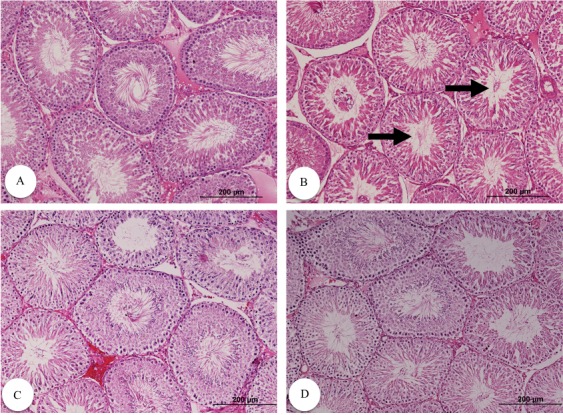
Fig. 1.

Testicular histological structure different groups stained with H&E (magnification: 100). Normal (A), diabetic (B), diabetic with 10 mg/kg VC (C) and diabetic with 40 mg/kg VC (D). Arrows indicate marked decrease in spermatozoon in the lumen of the tubules.
