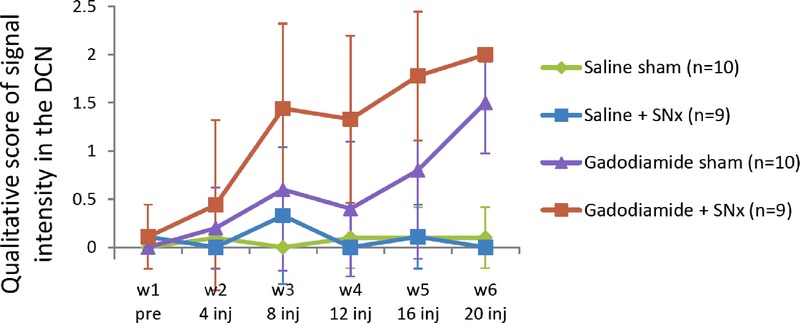
FIGURE 4.

Typical qualitative blinded evaluation: temporal changes in T1w signal enhancement between the DCN and surrounding cerebellar parenchyma, over the course of the injections (week 1: before the first injection; week 6: after 20 injections) (values are mean ± SD).
