
FIGURE 8.
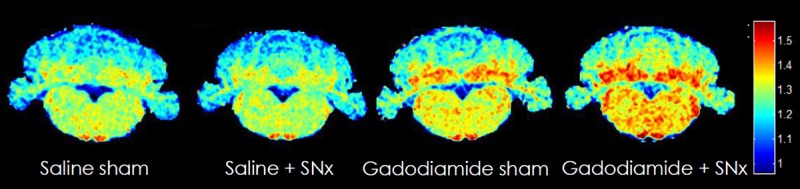
Typical R1 mapping in week 6. An important R1 increase is evidenced in the DCN of gadodiamide-treated rats. However, a diffuse increase in R1 value is also observed in the cerebellar parenchyma and the brain stem.
Official websites use .gov
A
.gov website belongs to an official
government organization in the United States.
Secure .gov websites use HTTPS
A lock (
) or https:// means you've safely
connected to the .gov website. Share sensitive
information only on official, secure websites.
Typical R1 mapping in week 6. An important R1 increase is evidenced in the DCN of gadodiamide-treated rats. However, a diffuse increase in R1 value is also observed in the cerebellar parenchyma and the brain stem.