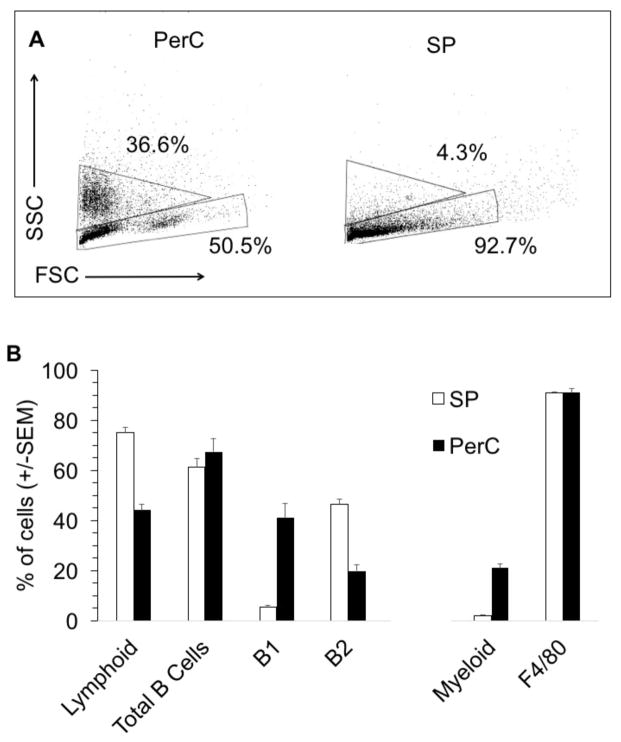
Figure 2. Greater myeloid composition of PerC cells.
FSC and SSC profiles of PerC and SP cells from C57BL/6J mice (A). Numbers reflect the percentage of myeloid (upper gate) and lymphoid (lower gate) cells and are representative of compiled data illustrated in panel B. Percentages of lymphoid cells, total B cells (IgM+), SP B1 (IgM+, CD5+) and B2 B (IgM+, CD5−) cells, PerC B1 (IgM+, CD11b+) and B2 (IgM+, CD11b−) cells, and percentages of myeloid cells, predominately macrophages (F4/80+, CD11b+), in C57BL/6J mice (B).

