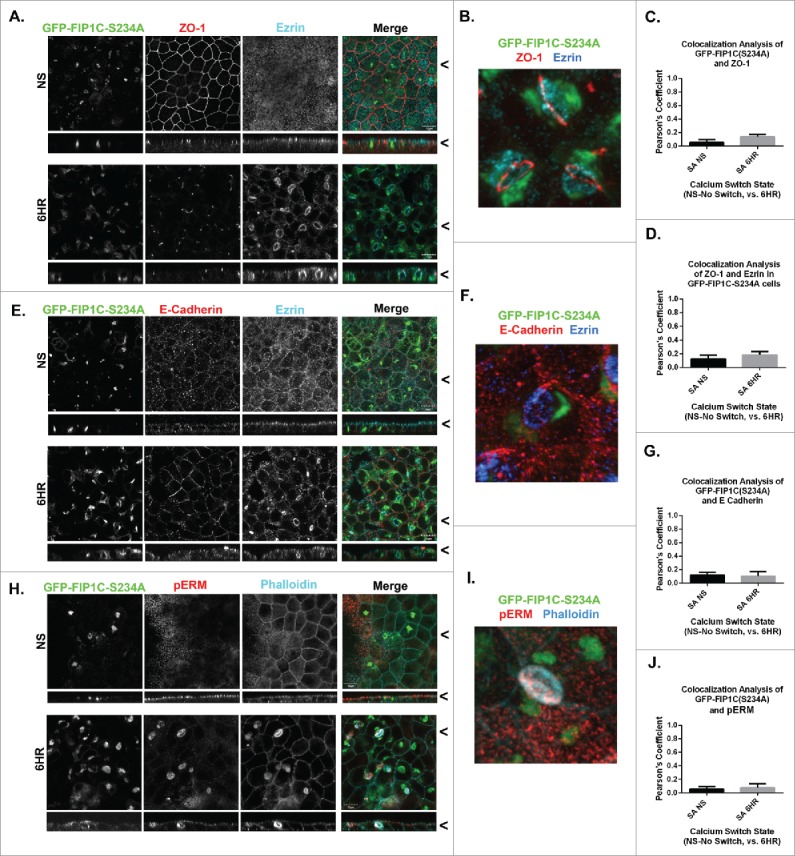
Figure 8.

Overexpression of GFP-Rab11-FIP1C-(S234A) causes relocalization of apical markers to lateral lumens after 6-hour calcium switch. GFP-FIP1C(S234A) expressing cells, either non-switched (NS) or fixed at 6 hours following calcium re-addition, were examined for localization of ZO-1 (A-C) or E-cadherin (D-G) along with ezrin immunostaining or for phospho-ERM (pERM) with phalloidin staining (H-J). A. Endogenous staining of ZO-1 6 hours after calcium switch in GFP-FIP1C(S234A) line showed redistribution of the tight junction protein to the border of lateral lumens. B. A still image taken from a 3-dimensional reconstruction showed ZO-1 completely encircling a lateral lumen. (see Movie S4). Colocalization analysis showed little colocalization between GFP-FIP1C(S234A) and ZO-1 (C) or between ZO-1 and Ezrin (D). E. E-Cadherin was excluded from the lateral lumen membrane following calcium switch. E-cadherin staining also relocated to the new luminal lateral membrane in these cells. F. In a still image from a 3-dimensional reconstruction, E-Cadherin was absent from the new apical membrane, marked with Ezrin in blue (see Movie S5). G. No significant colocalization of GFP-FIP1C(S234A) and E-Cadherin following calcium switch was observed. H. Endogenous staining for pERM in calcium switched, GFP-FIP1C(S234A) line showed pERM relocation to the lateral lumen surface. I. A still image taken from 3-dimensional reconstruction shows pERM co-labeling with phalloidin on the membrane of a lateral lumen (see Movie S6). J. No colocalization was observed for pERM with GFP-FIP1C(S234A) following calcium switch. X/Z images are shown below X/Y images, < indicates where images were taken for X/Y and X/Z planes. All scale bars = 10 µm. In C. D. G. and J, graphs plot mean Pearson's Coefficient and error bars represent standard deviation.
