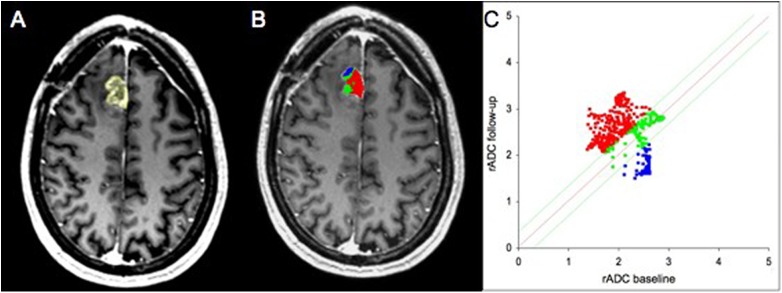
Fig 2. Analysis of a 49-year-old male patient with progressive disease (PD).
Contrast enhanced T1w MR images (A-B). Follow-up image with delineated tumor region of interest (ROI) (A). Parametric response map of relative apparent diffusion coefficient (rADC) (B). The resulting quantitave scatter plot (C). The voxels are color-coded corresponding to their changes between baseline and follow-up examinations. Blue is designated to voxels with a decrease of rADC ≥ 0.25, red to an increase of rACD < 0.25 and green to changes in between these thresholds.

