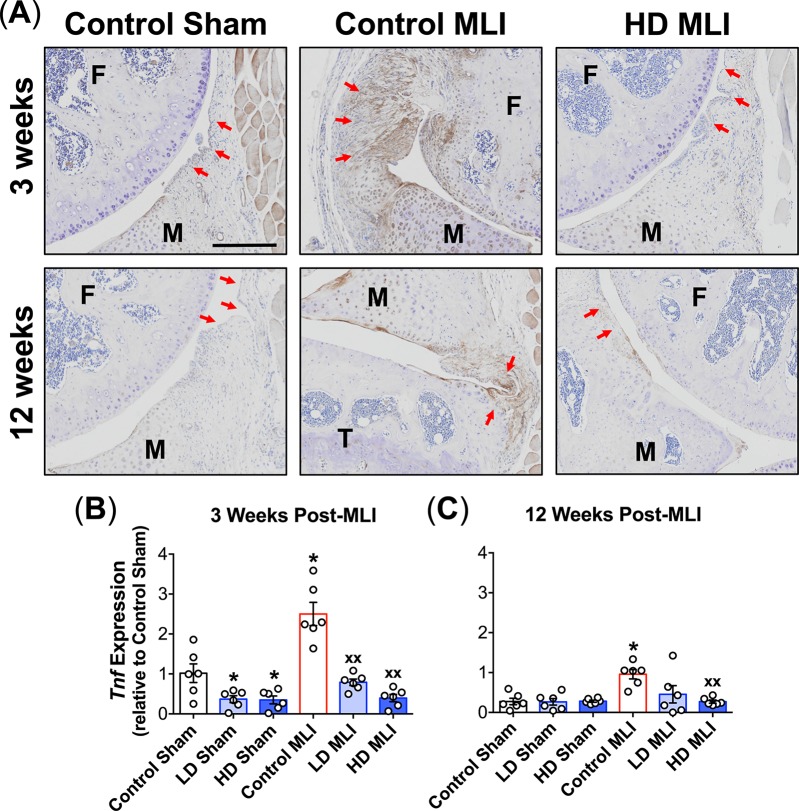
Fig 8. Post-injury upregulation of TNF in the synovium is reduced in mice supplemented with hCol1.
(A) Representative TNF immunostained sagittal sections (100x) from Sham and MLI joints of mice supplemented with Control (vehicle, hazelnut cream), LD hCol1 or HD hCol1 that were harvested at 3 and 12 weeks post-injury are shown. Joint structures are labeled (F = femur, M = meniscus, T = tibia), synovial membranes are demarcated with red arrows, and brown staining of the tissue indicates intensity and location of TNF expression. The black scale bar depicts 100μm. mRNA was purified from synovial tissue collected from a separate cohort of similarly-treated mice at 3 weeks (B) and 12 weeks (C) post-injury. qRTPCR was performed to quantify Tnf expression level. Symbols (○) represent the Tnf level in each synovial sample and bars represent the average Tnf level for each experimental group (± SEM, N = 6). Significant differences between groups were identified via one-way ANOVA with a Tukey’s multiple comparisons post-test (*p<0.05 compared to Control Sham, xxp<0.01 compared to Control MLI).

